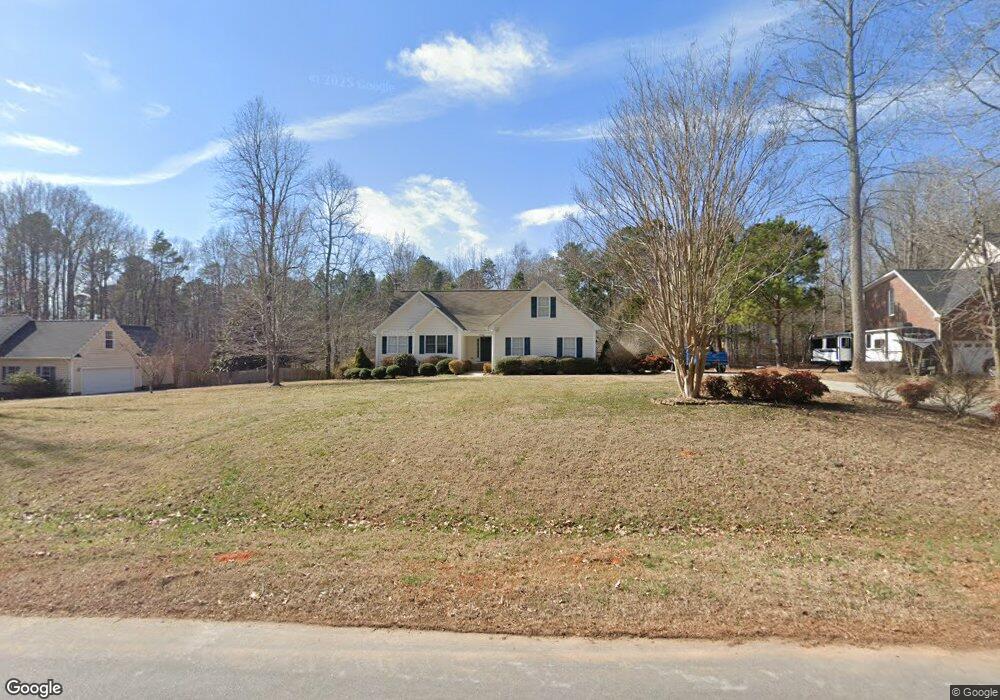
2186 Elliott St Oxford, NC 27565
Estimated Value: $280,000 - $346,000
3
Beds
2
Baths
1,668
Sq Ft
$189/Sq Ft
Est. Value
About This Home
This home is located at 2186 Elliott St, Oxford, NC 27565 and is currently estimated at $315,969, approximately $189 per square foot. 2186 Elliott St is a home located in Granville County with nearby schools including West Oxford Elementary School, Northern Granville Middle School, and J.F. Webb High School.
Ownership History
Date
Name
Owned For
Owner Type
Purchase Details
Closed on
Sep 8, 2015
Sold by
Hawkins Paul A
Bought by
Riggleman Ashley R and Riggleman Benjamin
Current Estimated Value
Home Financials for this Owner
Home Financials are based on the most recent Mortgage that was taken out on this home.
Original Mortgage
$162,011
Outstanding Balance
$129,337
Interest Rate
4.4%
Mortgage Type
FHA
Estimated Equity
$186,632
Purchase Details
Closed on
May 6, 2010
Sold by
Us Abnk Na
Bought by
Newton Nancy D
Purchase Details
Closed on
Feb 2, 2010
Sold by
Breese James R and Breese Laura A
Bought by
Us Bank Na
Purchase Details
Closed on
Jun 22, 2006
Sold by
Perez Rigoberto and Perez Zoraida M
Bought by
Breese Ii James R and Breese Laura A
Home Financials for this Owner
Home Financials are based on the most recent Mortgage that was taken out on this home.
Original Mortgage
$165,000
Interest Rate
10.15%
Mortgage Type
Adjustable Rate Mortgage/ARM
Create a Home Valuation Report for This Property
The Home Valuation Report is an in-depth analysis detailing your home's value as well as a comparison with similar homes in the area
Home Values in the Area
Average Home Value in this Area
Purchase History
| Date | Buyer | Sale Price | Title Company |
|---|---|---|---|
| Riggleman Ashley R | $165,000 | None Available | |
| Newton Nancy D | $150,000 | -- | |
| Us Bank Na | $111,883 | -- | |
| Breese Ii James R | $165,000 | -- |
Source: Public Records
Mortgage History
| Date | Status | Borrower | Loan Amount |
|---|---|---|---|
| Open | Riggleman Ashley R | $162,011 | |
| Previous Owner | Breese Ii James R | $165,000 |
Source: Public Records
Tax History Compared to Growth
Tax History
| Year | Tax Paid | Tax Assessment Tax Assessment Total Assessment is a certain percentage of the fair market value that is determined by local assessors to be the total taxable value of land and additions on the property. | Land | Improvement |
|---|---|---|---|---|
| 2025 | $1,925 | $274,351 | $41,860 | $232,491 |
| 2024 | $1,925 | $274,351 | $41,860 | $232,491 |
| 2023 | $1,922 | $176,771 | $27,747 | $149,024 |
| 2022 | $1,622 | $176,771 | $27,747 | $149,024 |
| 2021 | $1,511 | $176,771 | $27,747 | $149,024 |
| 2020 | $1,511 | $176,771 | $27,747 | $149,024 |
| 2019 | $1,511 | $176,771 | $27,747 | $149,024 |
| 2018 | $1,511 | $176,771 | $27,747 | $149,024 |
| 2016 | $1,386 | $154,500 | $27,747 | $126,753 |
| 2015 | $1,369 | $154,500 | $27,747 | $126,753 |
| 2014 | $1,369 | $154,500 | $27,747 | $126,753 |
| 2013 | -- | $154,500 | $27,747 | $126,753 |
Source: Public Records
Map
Nearby Homes
- 2536 Enon Rd
- 6035 Mary Lee Dr
- 2605 Joe Pruitt Rd
- 5148 Lucy Averette Rd
- 5606 Oakley Hill
- 6049 Mulberry Ln
- 6063 N Carolina 96
- 1545 Dogwood Dr
- 2665 Bodie Currin Rd
- 609 N Country Club Dr
- 616 Roxboro Rd
- 201 Providence Rd
- 204 Cardinal Ct
- 206 Cardinal Ct
- 5586 Shelton Creek Rd
- 96 North St
- 103 Alston Ct
- 105 W Thorndale Dr
- 316 Keeneland Dr
- 111 Ward Ave
- 2184 Elliott St
- 2188 Elliott St
- 2182 Elliott St
- 5580 Farmington Dr
- 5582 Farmington Dr
- 5578 Farmington Dr
- 2193 Elliott St
- 2191 Elliott St
- 2197 Elliott St
- 5584 Farmington Dr
- 5576 Farmington Dr
- 2189 Elliott St
- 2176 Elliott St
- 5586 Farmington Dr
- 5574 Farmington Dr
- Lot 13 Elliott St
- Lot 12 Elliott St
- 12&13 Elliott St
- 0 Elliott St
- LOT 22 Elliott St