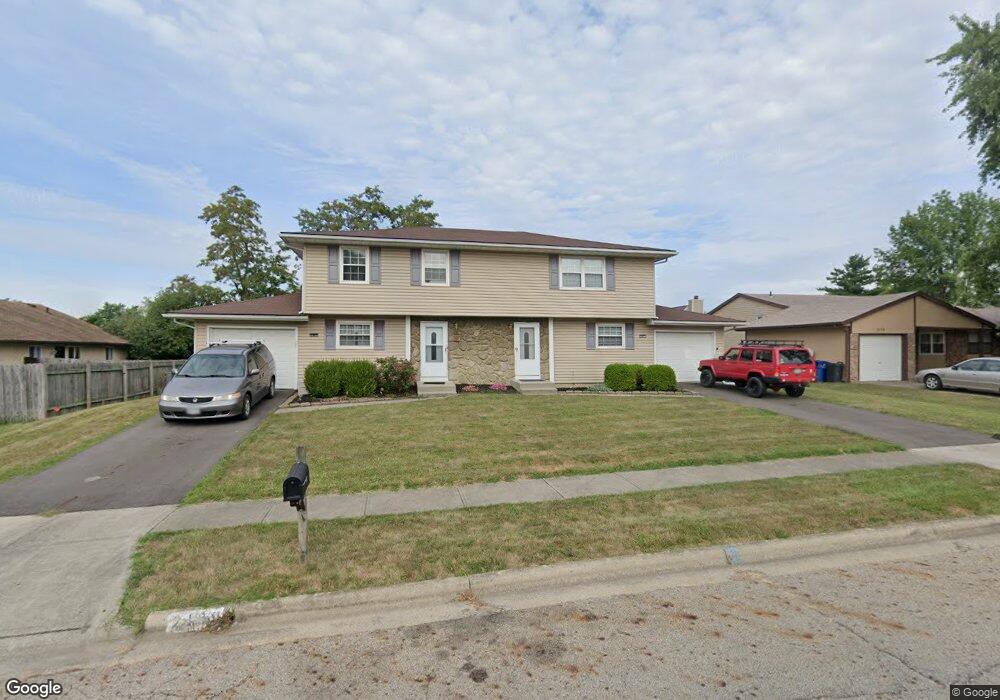
2187 Lynbridge Dr Unit 189 Reynoldsburg, OH 43068
Estimated Value: $288,504 - $356,000
5
Beds
4
Baths
2,200
Sq Ft
$150/Sq Ft
Est. Value
About This Home
This home is located at 2187 Lynbridge Dr Unit 189, Reynoldsburg, OH 43068 and is currently estimated at $330,376, approximately $150 per square foot. 2187 Lynbridge Dr Unit 189 is a home located in Franklin County with nearby schools including Slate Ridge Elementary School, Baldwin Road Junior High School, and Hannah J Ashton Middle School.
Ownership History
Date
Name
Owned For
Owner Type
Purchase Details
Closed on
Dec 4, 2018
Sold by
Selby Cheryl R
Bought by
Schwab Samuel F
Current Estimated Value
Home Financials for this Owner
Home Financials are based on the most recent Mortgage that was taken out on this home.
Original Mortgage
$161,500
Outstanding Balance
$142,285
Interest Rate
4.8%
Mortgage Type
New Conventional
Estimated Equity
$188,091
Purchase Details
Closed on
May 27, 2005
Sold by
Russo John W
Bought by
Selby Cheryl R
Home Financials for this Owner
Home Financials are based on the most recent Mortgage that was taken out on this home.
Original Mortgage
$132,000
Interest Rate
5.82%
Mortgage Type
Fannie Mae Freddie Mac
Purchase Details
Closed on
May 13, 1982
Bought by
Russo John W
Purchase Details
Closed on
May 1, 1980
Create a Home Valuation Report for This Property
The Home Valuation Report is an in-depth analysis detailing your home's value as well as a comparison with similar homes in the area
Home Values in the Area
Average Home Value in this Area
Purchase History
| Date | Buyer | Sale Price | Title Company |
|---|---|---|---|
| Schwab Samuel F | $170,000 | Total Title Svcs Llc | |
| Selby Cheryl R | $165,000 | Worthington | |
| Russo John W | -- | -- | |
| -- | $12,400 | -- |
Source: Public Records
Mortgage History
| Date | Status | Borrower | Loan Amount |
|---|---|---|---|
| Open | Schwab Samuel F | $161,500 | |
| Previous Owner | Selby Cheryl R | $132,000 |
Source: Public Records
Tax History Compared to Growth
Tax History
| Year | Tax Paid | Tax Assessment Tax Assessment Total Assessment is a certain percentage of the fair market value that is determined by local assessors to be the total taxable value of land and additions on the property. | Land | Improvement |
|---|---|---|---|---|
| 2024 | $4,940 | $87,470 | $21,040 | $66,430 |
| 2023 | $4,382 | $87,465 | $21,035 | $66,430 |
| 2022 | $3,663 | $55,300 | $9,870 | $45,430 |
| 2021 | $3,678 | $55,300 | $9,870 | $45,430 |
| 2020 | $3,705 | $55,300 | $9,870 | $45,430 |
| 2019 | $3,410 | $46,100 | $8,230 | $37,870 |
| 2018 | $3,479 | $46,100 | $8,230 | $37,870 |
| 2017 | $3,534 | $46,100 | $8,230 | $37,870 |
| 2016 | $3,611 | $43,050 | $7,420 | $35,630 |
| 2015 | $3,502 | $43,050 | $7,420 | $35,630 |
| 2014 | $3,518 | $43,050 | $7,420 | $35,630 |
| 2013 | $2,014 | $50,645 | $8,715 | $41,930 |
Source: Public Records
Map
Nearby Homes
- 6549 Santa Cruz Place
- 6348 E Livingston Ave
- 6682 Woodsedge Dr
- 0 Brice Rd
- 0 Radekin Rd Unit 225029852
- 6584 Benjamin Dr
- 1550 Idlewild Dr
- 6728 Greenbush Dr
- 6772 Gilette Dr
- 1888 Birkdale Dr
- 6775 Centennial Dr
- 6486 Ethan Dr
- 6658 Furth Dr
- 2997 Hubbardton Place
- 1324 Idlewild Dr
- 1334 Manor Dr
- 1328 Manor Dr
- 1603 Hallworth Ct Unit 16038
- 1826-1828 Bairsford Dr
- 6535 Canby Place
- 2187 Lynbridge Dr Unit 89
- 2187-2189 Lynbridge Dr
- 2177 Lynbridge Dr Unit 179
- 6334-6336 Birchview Dr
- 6334 Birchview Dr S Unit 336
- 2188 Lynbridge Dr
- 2171 Lynbridge Dr
- 2169 Lynbridge Dr Unit 171
- 6356 Birchview Dr S
- 6377 Cherroy Dr
- 6343-6345 Birchview Dr S
- 6364 Cherroy Dr
- 6335-6337 Birchview Dr
- 6335 Birchview Dr S Unit 337
- 6319 Birchview Dr S Unit 321
- 6343 Birchview Dr S Unit 345
- 6343 Birchview Dr S Unit 45
- 2153-2155 Lynbridge Dr
- 2153 Lynbridge Dr Unit 155
- 6370 Birchview Dr S Unit 372