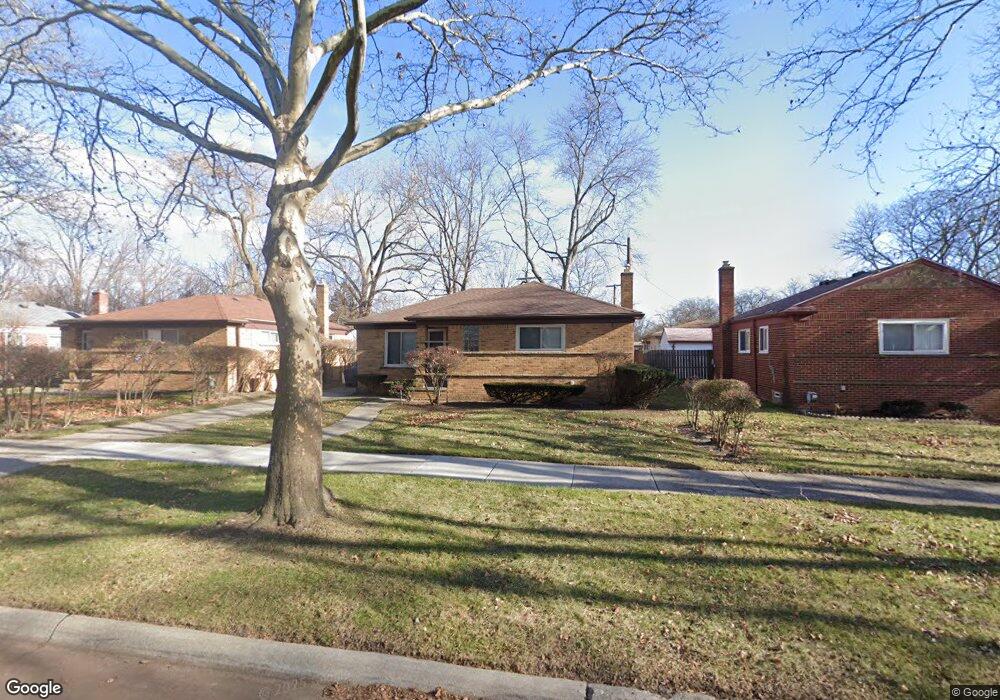
21870 Marlow St Oak Park, MI 48237
Estimated Value: $212,304 - $232,000
3
Beds
2
Baths
1,202
Sq Ft
$186/Sq Ft
Est. Value
About This Home
This home is located at 21870 Marlow St, Oak Park, MI 48237 and is currently estimated at $223,326, approximately $185 per square foot. 21870 Marlow St is a home located in Oakland County with nearby schools including Einstein Elementary School, Oak Park Service Learning Academy, and Oak Park Service Learning Academy Opsla.
Ownership History
Date
Name
Owned For
Owner Type
Purchase Details
Closed on
Sep 17, 2010
Sold by
Marroki Laith and Marroki Rawnek
Bought by
Harrison Stanley A
Current Estimated Value
Purchase Details
Closed on
Jun 30, 2009
Sold by
Secretary Of Housing & Urban Development
Bought by
Marroki Laith
Purchase Details
Closed on
Jul 23, 2007
Sold by
Chase Home Finance Llc
Bought by
Hud
Purchase Details
Closed on
Jan 16, 2007
Sold by
Vassell Lydia R and Teasley Ronald
Bought by
Chase Home Finance Llc
Purchase Details
Closed on
Jan 10, 2002
Sold by
Phillips J
Bought by
Teasley-Vassell Lydia R
Purchase Details
Closed on
Sep 13, 1994
Sold by
Newell Albert
Bought by
Phillips James L
Home Financials for this Owner
Home Financials are based on the most recent Mortgage that was taken out on this home.
Original Mortgage
$62,600
Interest Rate
8.62%
Mortgage Type
New Conventional
Create a Home Valuation Report for This Property
The Home Valuation Report is an in-depth analysis detailing your home's value as well as a comparison with similar homes in the area
Home Values in the Area
Average Home Value in this Area
Purchase History
| Date | Buyer | Sale Price | Title Company |
|---|---|---|---|
| Harrison Stanley A | $67,000 | Devon Title Agency | |
| Marroki Laith | $18,000 | None Available | |
| Hud | -- | None Available | |
| Chase Home Finance Llc | $145,043 | None Available | |
| Teasley-Vassell Lydia R | $127,000 | -- | |
| Phillips James L | $65,900 | -- |
Source: Public Records
Mortgage History
| Date | Status | Borrower | Loan Amount |
|---|---|---|---|
| Previous Owner | Phillips James L | $62,600 |
Source: Public Records
Tax History Compared to Growth
Tax History
| Year | Tax Paid | Tax Assessment Tax Assessment Total Assessment is a certain percentage of the fair market value that is determined by local assessors to be the total taxable value of land and additions on the property. | Land | Improvement |
|---|---|---|---|---|
| 2024 | $1,692 | $96,200 | $15,300 | $80,900 |
| 2023 | $1,623 | $84,500 | $13,600 | $70,900 |
| 2022 | $1,562 | $70,400 | $12,000 | $58,400 |
| 2021 | $1,556 | $63,400 | $6,200 | $57,200 |
| 2020 | $1,508 | $51,800 | $6,200 | $45,600 |
| 2018 | $1,517 | $33,700 | $0 | $0 |
| 2015 | -- | $26,800 | $0 | $0 |
| 2014 | -- | $23,400 | $0 | $0 |
| 2011 | -- | $31,700 | $0 | $0 |
Source: Public Records
Map
Nearby Homes
- 14610 Pearson St
- 21961 Whitmore St
- 21810 Stratford St
- 22020 Sussex St
- 22160 Whitmore St
- 22150 Beverly St
- 23041 Marlow St
- 23040 Marlow St
- 14211 Northend Ave
- 22130 Gardner St
- 21661 Cloverlawn St
- 23091 Sussex St
- 23110 Wildwood St
- 23040 Church St
- 21310 Gardner St
- 23136 Wildwood St
- 21701 Parklawn St
- 13941 Pearson St
- 21710 Parklawn St
- 23165 Church St
- 21880 Marlow St
- 21831 Sussex St
- 21860 Marlow St
- 21900 Marlow St
- 21885 Whitmore St
- 21875 Whitmore St
- 21910 Marlow St
- 21901 Whitmore St
- 21841 Sussex St
- 21871 Marlow St
- 21911 Whitmore St
- 21861 Marlow St
- 21881 Marlow St
- 21926 Marlow St
- 21816 Sussex St
- 21820 Sussex St
- 21851 Marlow St
- 21901 Marlow St
- 21824 Sussex St
- 21921 Whitmore St