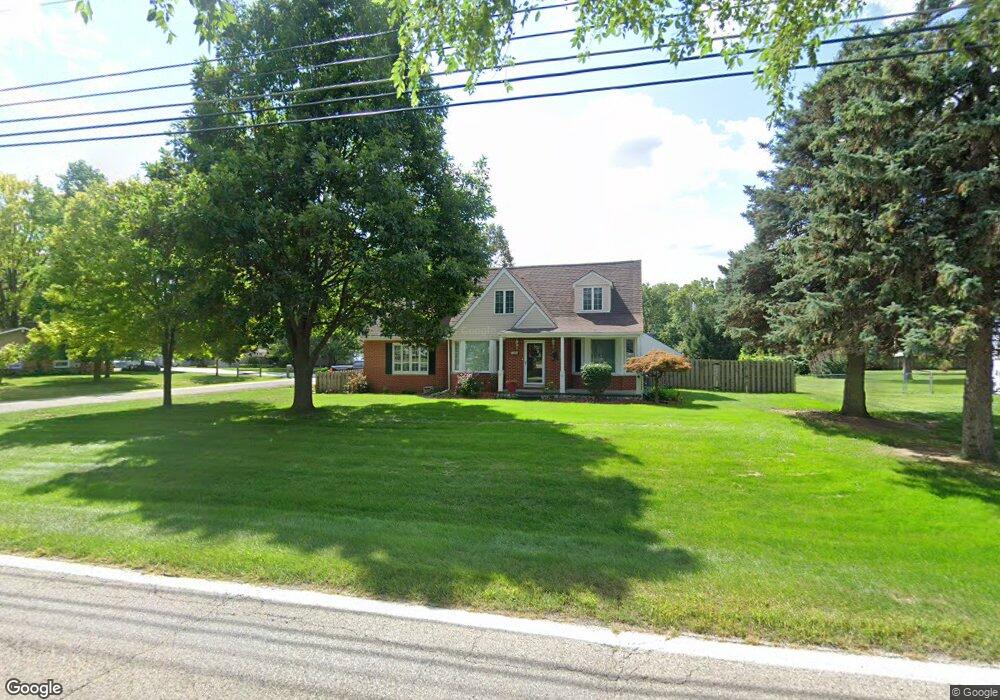
21874 S Nunneley Rd Unit Bldg-Unit Clinton Township, MI 48035
Estimated Value: $267,000 - $315,000
3
Beds
3
Baths
2,259
Sq Ft
$128/Sq Ft
Est. Value
About This Home
This home is located at 21874 S Nunneley Rd Unit Bldg-Unit, Clinton Township, MI 48035 and is currently estimated at $289,470, approximately $128 per square foot. 21874 S Nunneley Rd Unit Bldg-Unit is a home located in Macomb County with nearby schools including Clintondale High School, St. Thecla Catholic School, and Faith Christian School.
Ownership History
Date
Name
Owned For
Owner Type
Purchase Details
Closed on
May 23, 2018
Sold by
Dietz Laura
Bought by
Kasper Christine and Kasper Timothy
Current Estimated Value
Home Financials for this Owner
Home Financials are based on the most recent Mortgage that was taken out on this home.
Original Mortgage
$157,500
Outstanding Balance
$135,613
Interest Rate
4.4%
Mortgage Type
New Conventional
Estimated Equity
$153,857
Purchase Details
Closed on
May 11, 2018
Sold by
Haider Barbara A and Estate Of Gary Becker
Bought by
Dietz Laura
Home Financials for this Owner
Home Financials are based on the most recent Mortgage that was taken out on this home.
Original Mortgage
$157,500
Outstanding Balance
$135,613
Interest Rate
4.4%
Mortgage Type
New Conventional
Estimated Equity
$153,857
Purchase Details
Closed on
Jun 5, 2012
Sold by
Dietz Laura M
Bought by
Becker Gary
Purchase Details
Closed on
May 23, 2012
Sold by
The Bank Of New York Mellon
Bought by
Becker Gary and Dietz Laura M
Purchase Details
Closed on
Jun 16, 2011
Sold by
Jakubowski Dennis
Bought by
The Bank Of New York Mellon and The Bank Of New York
Create a Home Valuation Report for This Property
The Home Valuation Report is an in-depth analysis detailing your home's value as well as a comparison with similar homes in the area
Home Values in the Area
Average Home Value in this Area
Purchase History
| Date | Buyer | Sale Price | Title Company |
|---|---|---|---|
| Kasper Christine | $175,000 | Premier Title Agency Llc | |
| Dietz Laura | $71,550 | Premier Title | |
| Becker Gary | -- | None Available | |
| Becker Gary | $59,550 | Advantage Title Inc | |
| The Bank Of New York Mellon | $163,127 | None Available |
Source: Public Records
Mortgage History
| Date | Status | Borrower | Loan Amount |
|---|---|---|---|
| Open | Kasper Christine | $157,500 |
Source: Public Records
Tax History Compared to Growth
Tax History
| Year | Tax Paid | Tax Assessment Tax Assessment Total Assessment is a certain percentage of the fair market value that is determined by local assessors to be the total taxable value of land and additions on the property. | Land | Improvement |
|---|---|---|---|---|
| 2025 | $4,836 | $136,400 | $0 | $0 |
| 2024 | $3,064 | $128,200 | $0 | $0 |
| 2023 | $2,908 | $109,400 | $0 | $0 |
| 2022 | $4,382 | $103,900 | $0 | $0 |
| 2021 | $4,260 | $93,600 | $0 | $0 |
| 2020 | $2,665 | $92,500 | $0 | $0 |
| 2019 | $3,982 | $88,400 | $0 | $0 |
| 2018 | $3,183 | $80,600 | $0 | $0 |
| 2017 | $3,161 | $72,000 | $13,200 | $58,800 |
| 2016 | $3,477 | $72,000 | $0 | $0 |
| 2015 | -- | $63,800 | $0 | $0 |
| 2014 | -- | $61,100 | $0 | $0 |
| 2011 | -- | $70,700 | $17,600 | $53,100 |
Source: Public Records
Map
Nearby Homes
- 21934 S Nunneley Rd
- 21885 N Nunneley Rd
- 21903 Elmway St
- 22459 Katzman St
- 36426 Weideman St
- 22317 E Schafer St
- 21600 Elmway St
- 22252 Dale Allen St
- 36335 Weideman St
- 36621 Suffolk St
- 22311 Spitzley St
- 21769 Ulrich St
- 36047 Weideman St
- 21445 Drexel St
- 21404 Drexel St
- 35811 Weideman St
- 21640 Hillside #3c Dr
- 20790 Shoreview St
- 22948 E Schafer St
- 21510 Remick Dr
- 21874 S Nunneley Rd
- 21854 S Nunneley Rd
- 21914 S Nunneley Rd
- 36815 Birwood St
- 21834 S Nunneley Rd
- 36797 Birwood St
- 36816 Birwood St
- 36816 Mulberry St
- 21814 S Nunneley Rd
- 36798 Mulberry St
- 36777 Birwood St
- 36788 Birwood St
- 21954 S Nunneley Rd
- 21961 Lester St
- 36776 Mulberry St
- 36770 Birwood St
- 21674 S Nunneley Rd
- 21974 S Nunneley Rd
- 21971 Lester St
- 21960 Lester St