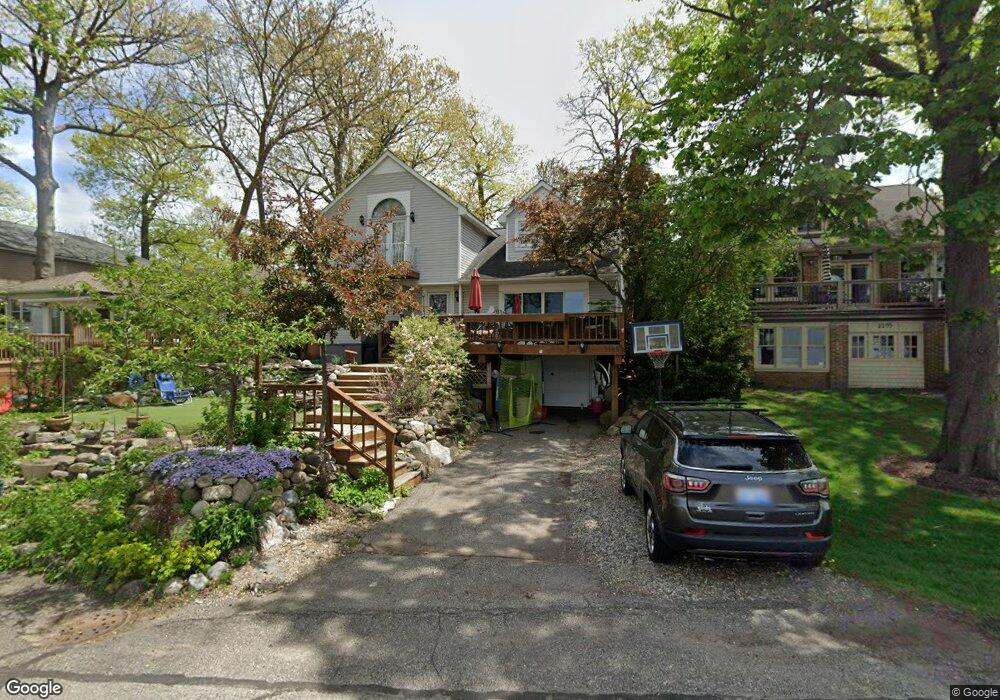
2189 Ferndale St Sylvan Lake, MI 48320
Estimated Value: $639,000 - $1,058,000
5
Beds
3
Baths
2,400
Sq Ft
$315/Sq Ft
Est. Value
About This Home
This home is located at 2189 Ferndale St, Sylvan Lake, MI 48320 and is currently estimated at $755,808, approximately $314 per square foot. 2189 Ferndale St is a home located in Oakland County with nearby schools including Walt Whitman Elementary School, Pontiac Middle School, and Pontiac High School.
Ownership History
Date
Name
Owned For
Owner Type
Purchase Details
Closed on
Oct 31, 2014
Sold by
Farms Richard B and Farms Jonathan R
Bought by
Farms Jonathan R
Current Estimated Value
Purchase Details
Closed on
Jul 24, 2013
Sold by
Farms Richard B
Bought by
Farms Richard B and Farms Jonathan R
Home Financials for this Owner
Home Financials are based on the most recent Mortgage that was taken out on this home.
Original Mortgage
$200,000
Outstanding Balance
$142,850
Interest Rate
4.21%
Mortgage Type
Seller Take Back
Estimated Equity
$612,958
Purchase Details
Closed on
Aug 22, 2005
Sold by
Pernick Lisa K and Isreal Bruce F
Bought by
Krause Frederick E and Krause Kelli
Purchase Details
Closed on
Jan 7, 2003
Sold by
Farms Linda S
Bought by
Farms Richard B
Purchase Details
Closed on
Dec 16, 2002
Sold by
Pernick Lisa K
Bought by
Israel Bruce F and Pernick Lisa K
Purchase Details
Closed on
Jan 29, 1996
Sold by
Richard B Farms
Bought by
Richard B Farms
Create a Home Valuation Report for This Property
The Home Valuation Report is an in-depth analysis detailing your home's value as well as a comparison with similar homes in the area
Home Values in the Area
Average Home Value in this Area
Purchase History
| Date | Buyer | Sale Price | Title Company |
|---|---|---|---|
| Farms Jonathan R | -- | None Available | |
| Farms Richard B | -- | None Available | |
| Krause Frederick E | $800,000 | Multiple | |
| Farms Richard B | -- | -- | |
| Israel Bruce F | -- | Title Source | |
| Richard B Farms | -- | -- |
Source: Public Records
Mortgage History
| Date | Status | Borrower | Loan Amount |
|---|---|---|---|
| Open | Farms Richard B | $200,000 |
Source: Public Records
Tax History Compared to Growth
Tax History
| Year | Tax Paid | Tax Assessment Tax Assessment Total Assessment is a certain percentage of the fair market value that is determined by local assessors to be the total taxable value of land and additions on the property. | Land | Improvement |
|---|---|---|---|---|
| 2024 | $5,332 | $284,380 | $0 | $0 |
| 2023 | $5,119 | $274,320 | $0 | $0 |
| 2022 | $5,333 | $249,830 | $0 | $0 |
| 2021 | $5,120 | $242,480 | $0 | $0 |
| 2020 | $5,038 | $238,560 | $0 | $0 |
| 2019 | $5,326 | $229,650 | $0 | $0 |
| 2018 | $5,188 | $195,140 | $0 | $0 |
| 2017 | $5,159 | $187,620 | $0 | $0 |
| 2016 | $5,223 | $175,790 | $0 | $0 |
| 2015 | -- | $184,290 | $0 | $0 |
| 2014 | -- | $152,570 | $0 | $0 |
| 2011 | -- | $159,130 | $0 | $0 |
Source: Public Records
Map
Nearby Homes
- 49 Canal Dr Unit 300-049
- 21 Canal Dr Unit 300-021
- 27 Riverbank Dr Unit 300-127
- 25 Riverbank Dr Unit 300-125
- 14 Riverbank Dr Unit 300-114
- 26 Edna Ave
- 1796 Briarcliff St
- 1775 Woodland Ave
- 1160 Dorchester Ave
- 1785 Ward Rd
- 1061 Dorchester Ave
- 990 Voorheis Rd
- 1660 Beechmont St
- 1075 Canterbury Dr
- 147 Draper Ave
- 2820 Wall St
- 2084 Woodrow Wilson Blvd Unit A6
- 1205 Leinbach Ave
- 1030 Menominee Rd
- 2825 Wall St
- 2195 Ferndale St
- 2181 Ferndale St
- 2177 Ferndale St
- 2186 Garland St
- 2180 Garland St
- 2196 Garland St
- 2208 Garland St
- 2171 Ferndale St
- 2172 Garland St
- 2214 Garland St
- 2156 Garland St
- 2167 Ferndale St
- 2150 Garland St
- 2144 Garland St
- 2163 Ferndale St
- 2195 Garland St
- 2181 Garland St
- 2234 Garland St
- 2205 Garland St
- 2165 Garland St