Estimated Value: $118,688 - $138,000
4
Beds
1
Bath
1,344
Sq Ft
$95/Sq Ft
Est. Value
About This Home
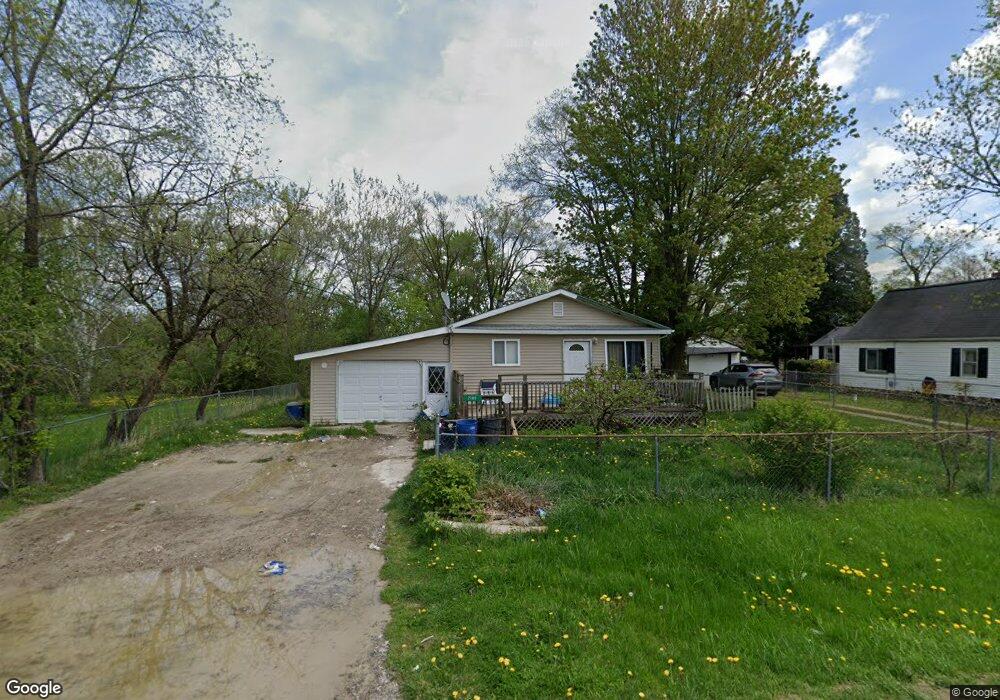
This home is located at 2189 Monaco St, Flint, MI 48532 and is currently estimated at $127,172, approximately $94 per square foot. 2189 Monaco St is a home located in Genesee County with nearby schools including Carman-Ainsworth High School, Genesee STEM Academy, and St. Paul Lutheran School.
Ownership History
Date
Name
Owned For
Owner Type
Purchase Details
Closed on
Jul 21, 2025
Sold by
Headlands Asset Management Fund Iii Seri
Bought by
Headlands Alternative Investments Lp
Current Estimated Value
Purchase Details
Closed on
Oct 29, 2015
Sold by
Harbour Portfolio Viii Lp
Bought by
Headlands Asset Management Fund Iii Seri
Purchase Details
Closed on
Aug 18, 2014
Sold by
Harbour Portfolio Viii Lp
Bought by
Avery Anthony J
Home Financials for this Owner
Home Financials are based on the most recent Mortgage that was taken out on this home.
Original Mortgage
$44,800
Interest Rate
9.9%
Mortgage Type
Seller Take Back
Purchase Details
Closed on
Jun 2, 2014
Sold by
Fannie Mae
Bought by
Harbour Portfolio Viii Lp
Purchase Details
Closed on
Oct 9, 2013
Sold by
Underwood Rossanna
Bought by
Federal National Mortgage Assocition
Purchase Details
Closed on
Oct 19, 2006
Sold by
Bysko Mitchell and Bysko Cristal
Bought by
Underwood Rosanna
Create a Home Valuation Report for This Property
The Home Valuation Report is an in-depth analysis detailing your home's value as well as a comparison with similar homes in the area
Home Values in the Area
Average Home Value in this Area
Purchase History
| Date | Buyer | Sale Price | Title Company |
|---|---|---|---|
| Headlands Alternative Investments Lp | -- | None Listed On Document | |
| Headlands Asset Management Fund Iii Seri | $31,481 | None Available | |
| Avery Anthony J | $45,400 | None Available | |
| Harbour Portfolio Viii Lp | $10,309 | Servicelink Llc | |
| Federal National Mortgage Assocition | $72,427 | None Available | |
| Underwood Rosanna | $81,660 | Sargents Title Company |
Source: Public Records
Mortgage History
| Date | Status | Borrower | Loan Amount |
|---|---|---|---|
| Previous Owner | Avery Anthony J | $44,800 |
Source: Public Records
Tax History
| Year | Tax Paid | Tax Assessment Tax Assessment Total Assessment is a certain percentage of the fair market value that is determined by local assessors to be the total taxable value of land and additions on the property. | Land | Improvement |
|---|---|---|---|---|
| 2025 | $2,375 | $53,800 | $0 | $0 |
| 2024 | $1,409 | $48,000 | $0 | $0 |
| 2023 | $1,309 | $38,800 | $0 | $0 |
| 2022 | $859 | $35,000 | $0 | $0 |
| 2021 | $842 | $32,300 | $0 | $0 |
| 2020 | $1,169 | $27,600 | $0 | $0 |
| 2019 | $1,157 | $23,300 | $0 | $0 |
| 2018 | $2,102 | $27,800 | $0 | $0 |
| 2017 | $2,275 | $27,800 | $0 | $0 |
| 2016 | $2,083 | $25,500 | $0 | $0 |
| 2015 | $1,423 | $24,700 | $0 | $0 |
| 2014 | $563 | $23,600 | $0 | $0 |
| 2012 | -- | $27,600 | $27,600 | $0 |
Source: Public Records
Map
Nearby Homes
- 18.41 Taft Rd
- 2033 Eberly Rd
- 10 Acres T A Mansour Blvd
- 1512 Crescent Lane Dr Lot#46
- 1455 S Linden Rd
- 4474 Corunna Rd
- 4480 Corunna Rd
- 4335 Lennon Rd
- 4199 Sheraton Dr
- 2521 White Oak Place
- 3277 Whitney Ave
- 3088 Curtis Dr
- VL Clairmont St
- 4490 W Lennon Rd
- 0 Charter Dr Unit 50153638
- 3365 Ridgecliffe Dr
- 3.9 Acres W Court St
- 3139 Red Barn Rd
- 5151 Brobeck St
- 5200 Elko St
- 2177 Monaco St
- 4164 Larchmont St
- 2197 Monaco St
- 2184 Anoka St
- 2182 Monaco St
- 2188 Monaco St
- 2200 Anoka St
- 2167 Monaco St
- 2206 Monaco St
- 2166 Monaco St
- 2164 Monaco St
- 4165 Larchmont St
- 2166 Anoka St
- 2187 Anoka St
- 2193 Anoka St
- 2149 Monaco St
- 2155 Monaco St
- 2181 Diamond Ave
- 2216 Anoka St
- 2181 Anoka St
Your Personal Tour Guide
Ask me questions while you tour the home.