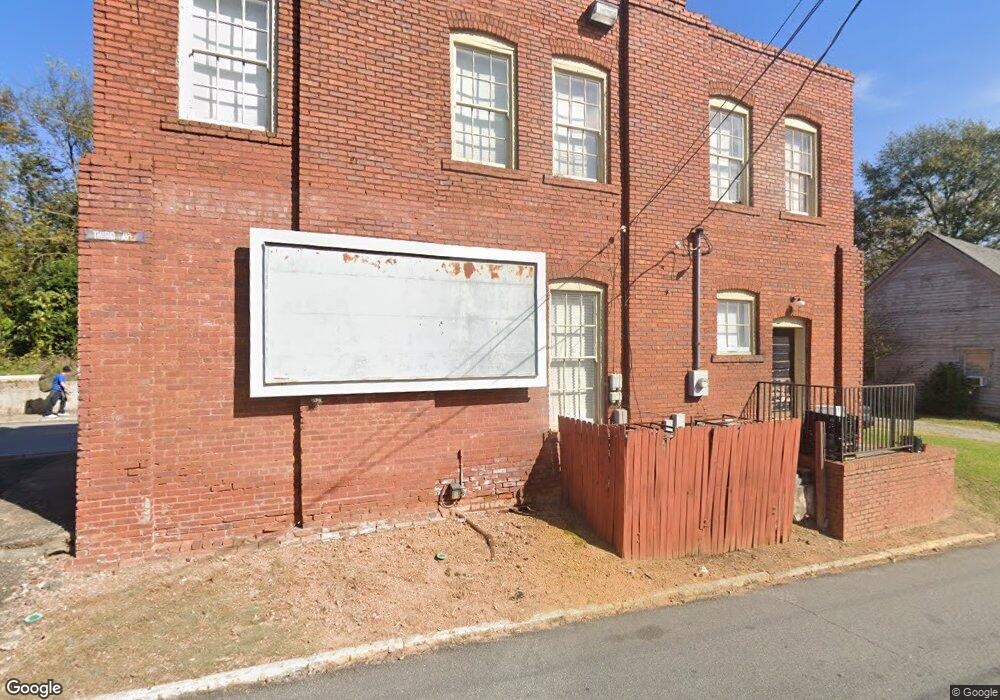
2189 Third Ave Macon, GA 31204
Pleasant Hill Historic District NeighborhoodEstimated Value: $86,446
4
Beds
2
Baths
2,240
Sq Ft
$39/Sq Ft
Est. Value
About This Home
This home is located at 2189 Third Ave, Macon, GA 31204 and is currently estimated at $86,446, approximately $38 per square foot. 2189 Third Ave is a home located in Bibb County with nearby schools including Williams Elementary School, Miller Fine Arts Magnet Middle School, and Central High School.
Ownership History
Date
Name
Owned For
Owner Type
Purchase Details
Closed on
Oct 16, 2015
Sold by
2189 Third Avenue Llc
Bought by
Elder Kwesi and Elder Lutrecia
Current Estimated Value
Purchase Details
Closed on
Jun 18, 2008
Sold by
Bp Thompson Second Lp
Bought by
Crosley Pascal G
Home Financials for this Owner
Home Financials are based on the most recent Mortgage that was taken out on this home.
Original Mortgage
$40,591
Interest Rate
5.96%
Mortgage Type
Commercial
Purchase Details
Closed on
May 6, 2008
Sold by
Prg Realty Llc
Bought by
Bp Thompson Second Lp
Home Financials for this Owner
Home Financials are based on the most recent Mortgage that was taken out on this home.
Original Mortgage
$40,591
Interest Rate
5.96%
Mortgage Type
Commercial
Purchase Details
Closed on
Aug 25, 2006
Sold by
Professional Realty Group
Bought by
Prg Realty Llc
Purchase Details
Closed on
Sep 17, 2003
Create a Home Valuation Report for This Property
The Home Valuation Report is an in-depth analysis detailing your home's value as well as a comparison with similar homes in the area
Home Values in the Area
Average Home Value in this Area
Purchase History
| Date | Buyer | Sale Price | Title Company |
|---|---|---|---|
| Elder Kwesi | $41,118 | -- | |
| Crosley Pascal G | $40,590 | None Available | |
| Bp Thompson Second Lp | $102,300 | None Available | |
| Bp Thompson Second Lp | $63,000 | None Available | |
| Prg Realty Llc | -- | None Available | |
| -- | $5,000 | -- | |
| -- | $5,000 | -- |
Source: Public Records
Mortgage History
| Date | Status | Borrower | Loan Amount |
|---|---|---|---|
| Previous Owner | Crosley Pascal G | $40,591 | |
| Previous Owner | Bp Thompson Second Lp | $40,591 |
Source: Public Records
Tax History
| Year | Tax Paid | Tax Assessment Tax Assessment Total Assessment is a certain percentage of the fair market value that is determined by local assessors to be the total taxable value of land and additions on the property. | Land | Improvement |
|---|---|---|---|---|
| 2025 | $1,243 | $50,570 | $7,904 | $42,666 |
| 2024 | $1,284 | $50,570 | $7,904 | $42,666 |
| 2023 | $1,186 | $46,692 | $7,904 | $38,788 |
| 2022 | $560 | $16,176 | $2,134 | $14,042 |
| 2021 | $615 | $16,176 | $2,134 | $14,042 |
| 2020 | $628 | $16,176 | $2,134 | $14,042 |
| 2019 | $633 | $16,176 | $2,134 | $14,042 |
| 2018 | $970 | $16,176 | $2,134 | $14,042 |
| 2017 | $609 | $16,265 | $2,134 | $14,131 |
| 2016 | $563 | $16,265 | $2,134 | $14,131 |
| 2015 | $970 | $19,798 | $2,134 | $17,664 |
| 2014 | $1,115 | $19,798 | $2,134 | $17,664 |
Source: Public Records
Map
Nearby Homes
- 151 Culver St
- 2155 Ferguson St
- 2129 Roosevelt Ave
- 2089 Walnut St
- 128 Lamar St
- 175 Corbin Ave Unit B
- 175 Corbin Ave Unit B
- 175 Corbin Ave
- 175 Corbin Ave Unit A
- 175 Corbin Ave Unit A
- 319 Ruby St
- 254 Forest Ave
- 2033 Third Ave
- 192 Corbin Ave
- 227 Corbin Ave
- 155 Forest Ave
- 155 Calloway Dr
- 313 Forest Ave
- 180 Ward St
- 320 Lincoln Ave
- 2183 3rd Ave
- 2186 Third Ave
- 2191 Walnut St
- 2189 Walnut St
- 2176 Third Ave
- 2206 Clayton St
- 2185 Walnut St
- 2205 Clayton St
- 2215 Clayton St
- 2216 Clayton St
- 2168 Third Ave
- 192 Culver St
- 2165 Third Ave
- 2175 Walnut St
- 315 Gaillard St
- 186 Culver St
- 2220 Clayton St
- 2193 Walnut St
- 2162 Third Ave Unit VV42-1B
- 2162 Third Ave
Your Personal Tour Guide
Ask me questions while you tour the home.