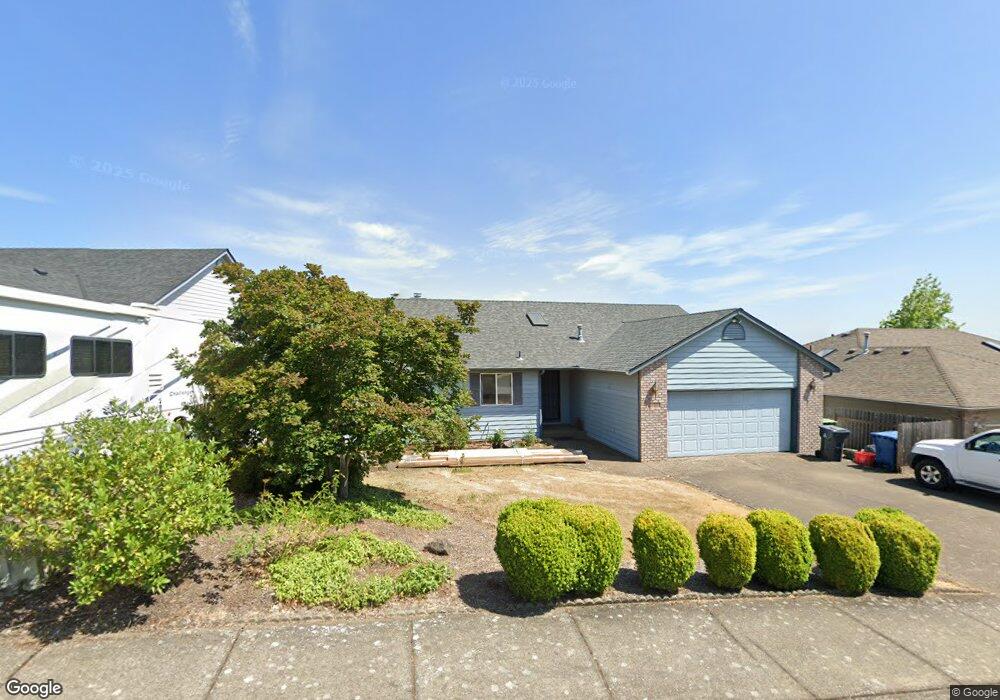
2189 Western Heights Loop NW Salem, OR 97304
West Salem NeighborhoodEstimated Value: $459,000 - $490,000
3
Beds
2
Baths
1,750
Sq Ft
$271/Sq Ft
Est. Value
About This Home
This home is located at 2189 Western Heights Loop NW, Salem, OR 97304 and is currently estimated at $473,994, approximately $270 per square foot. 2189 Western Heights Loop NW is a home located in Polk County with nearby schools including Myers Elementary School, Walker Middle School, and West Salem High School.
Ownership History
Date
Name
Owned For
Owner Type
Purchase Details
Closed on
Sep 15, 2008
Sold by
Citimortgage Inc
Bought by
Adkins Ronnie L and Adkins Tammy D
Current Estimated Value
Home Financials for this Owner
Home Financials are based on the most recent Mortgage that was taken out on this home.
Original Mortgage
$202,231
Outstanding Balance
$133,152
Interest Rate
6.31%
Mortgage Type
FHA
Estimated Equity
$340,842
Purchase Details
Closed on
Jun 17, 2008
Sold by
Tucker Randy N and Tucker Lynn M
Bought by
Citimortgage Inc
Purchase Details
Closed on
Apr 3, 2006
Sold by
Kay James E and Kay Beverly J
Bought by
Kay James E and Kay Beverly J
Create a Home Valuation Report for This Property
The Home Valuation Report is an in-depth analysis detailing your home's value as well as a comparison with similar homes in the area
Home Values in the Area
Average Home Value in this Area
Purchase History
| Date | Buyer | Sale Price | Title Company |
|---|---|---|---|
| Adkins Ronnie L | $204,900 | First American Title | |
| Citimortgage Inc | $169,900 | First American Title | |
| Kay James E | -- | None Available |
Source: Public Records
Mortgage History
| Date | Status | Borrower | Loan Amount |
|---|---|---|---|
| Open | Adkins Ronnie L | $202,231 |
Source: Public Records
Tax History Compared to Growth
Tax History
| Year | Tax Paid | Tax Assessment Tax Assessment Total Assessment is a certain percentage of the fair market value that is determined by local assessors to be the total taxable value of land and additions on the property. | Land | Improvement |
|---|---|---|---|---|
| 2025 | $5,022 | $274,470 | $92,250 | $182,220 |
| 2024 | $5,022 | $266,480 | $89,560 | $176,920 |
| 2023 | $4,876 | $258,720 | $86,950 | $171,770 |
| 2022 | $4,720 | $251,190 | $84,420 | $166,770 |
| 2021 | $4,585 | $243,880 | $81,960 | $161,920 |
| 2020 | $4,449 | $236,780 | $79,570 | $157,210 |
| 2019 | $4,294 | $229,890 | $77,250 | $152,640 |
| 2018 | $4,223 | $223,200 | $75,000 | $148,200 |
| 2017 | $3,806 | $216,700 | $72,820 | $143,880 |
| 2016 | $3,715 | $210,390 | $70,700 | $139,690 |
| 2015 | $3,649 | $191,730 | $53,000 | $138,730 |
| 2014 | $3,375 | $188,780 | $54,000 | $134,780 |
Source: Public Records
Map
Nearby Homes
- 2113 Western Heights Ct NW
- 980 Burley Hill Dr NW
- 971 Windemere Dr NW
- 1992 Summit Ave NW
- 1001 Doe Ct NW
- 2142 Westfarthing Way NW
- 810 22nd Ave NW
- 1798 Sunburst Terrace NW
- 842 Kingwood Dr NW
- 1782 Sunburst Terrace NW
- 2351 Westfarthing Way NW
- 1387 Windsong Ct NW
- 1778 Sunburst Terrace NW
- 621 Timber View St NW Unit 11 St NW
- 601 Timber View St NW Unit 13 St NW
- 2620 Dalke Ridge Dr NW
- 2650 Hoo Doo Dr NW
- 921 Dalke Ridge Ct NW
- 2645 Tyler Ct NW
- 1784 Ptarmigan St NW
- 2185 Western Heights Loop NW
- 2191 Western Heights Loop NW
- 996 Burley Hill Dr NW
- 2096 Rollin Ave NW
- 994 Burley Hill Dr NW
- 2181 Western Heights Loop NW
- 2195 Western Heights Loop NW
- 2086 Rollin Ave NW
- 2190 Western Heights Loop NW
- 2188 Western Heights Lp
- 2188 Western Heights Loop NW
- 2184 Western Heights Loop NW
- 2184 Western Heights Loop NW
- 2076 Rollin Ave NW
- 2194 Western Heights Loop NW
- 2180 Western Heights Loop NW
- 2180 Western Heights Loop NW
- 2179 Western Heights Loop NW
- 984 Burley Hill Dr NW
- 2143 Western Heights Ct NW