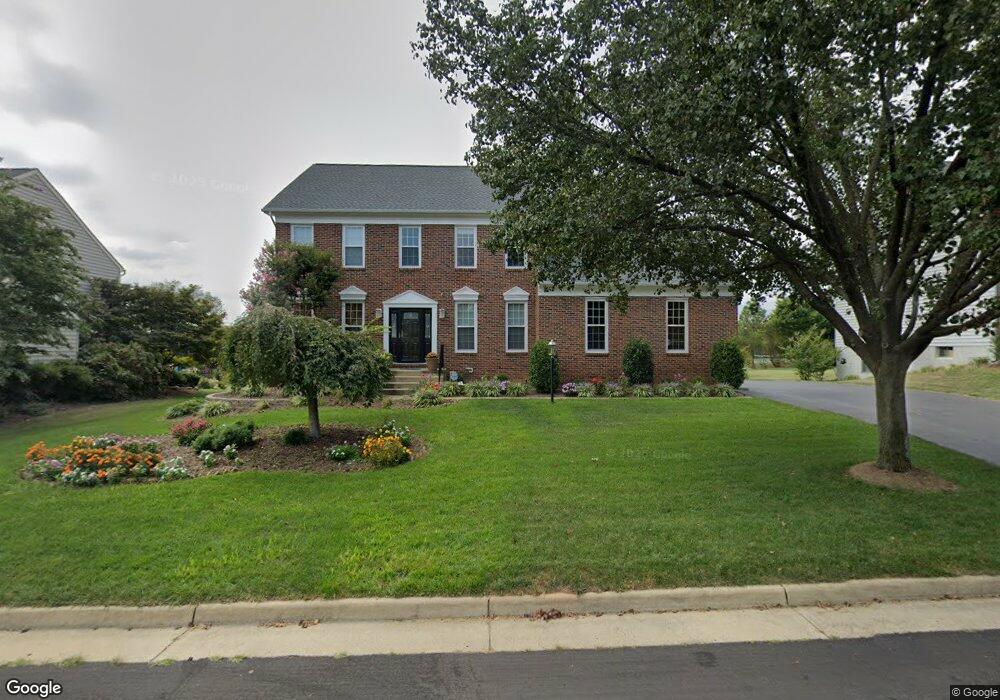
21891 Hyde Park Dr Ashburn, VA 20147
Estimated Value: $1,080,829 - $1,163,000
4
Beds
4
Baths
2,630
Sq Ft
$426/Sq Ft
Est. Value
About This Home
This home is located at 21891 Hyde Park Dr, Ashburn, VA 20147 and is currently estimated at $1,120,707, approximately $426 per square foot. 21891 Hyde Park Dr is a home located in Loudoun County with nearby schools including Discovery Elementary School, Farmwell Station Middle School, and Broad Run High School.
Ownership History
Date
Name
Owned For
Owner Type
Purchase Details
Closed on
Nov 29, 2005
Sold by
Michalowski Roberta
Bought by
Miholovich Stephen
Current Estimated Value
Home Financials for this Owner
Home Financials are based on the most recent Mortgage that was taken out on this home.
Original Mortgage
$517,500
Outstanding Balance
$286,959
Interest Rate
6.14%
Mortgage Type
New Conventional
Estimated Equity
$833,748
Purchase Details
Closed on
May 30, 1997
Sold by
Randolph Williams Inc
Bought by
Michalowski J K and Michalowski Roberta R
Home Financials for this Owner
Home Financials are based on the most recent Mortgage that was taken out on this home.
Original Mortgage
$227,450
Interest Rate
8.09%
Mortgage Type
New Conventional
Purchase Details
Closed on
Dec 23, 1996
Sold by
Equity Homes Lp
Bought by
Randolph Williams Inc
Purchase Details
Closed on
Dec 6, 1996
Sold by
Glennwood Lc
Bought by
Equity Homes Lp
Create a Home Valuation Report for This Property
The Home Valuation Report is an in-depth analysis detailing your home's value as well as a comparison with similar homes in the area
Home Values in the Area
Average Home Value in this Area
Purchase History
| Date | Buyer | Sale Price | Title Company |
|---|---|---|---|
| Miholovich Stephen | $690,000 | -- | |
| Michalowski J K | $285,460 | Island Title Corp | |
| Randolph Williams Inc | $85,000 | Island Title Corp | |
| Equity Homes Lp | $85,000 | Island Title Corp |
Source: Public Records
Mortgage History
| Date | Status | Borrower | Loan Amount |
|---|---|---|---|
| Open | Miholovich Stephen | $517,500 | |
| Previous Owner | Equity Homes Lp | $227,450 |
Source: Public Records
Tax History Compared to Growth
Tax History
| Year | Tax Paid | Tax Assessment Tax Assessment Total Assessment is a certain percentage of the fair market value that is determined by local assessors to be the total taxable value of land and additions on the property. | Land | Improvement |
|---|---|---|---|---|
| 2025 | $8,323 | $1,033,960 | $359,600 | $674,360 |
| 2024 | $8,630 | $997,740 | $359,600 | $638,140 |
| 2023 | $8,249 | $942,690 | $359,600 | $583,090 |
| 2022 | $7,315 | $821,870 | $299,600 | $522,270 |
| 2021 | $7,474 | $762,680 | $274,600 | $488,080 |
| 2020 | $7,507 | $725,340 | $274,600 | $450,740 |
| 2019 | $7,437 | $711,720 | $249,600 | $462,120 |
| 2018 | $7,313 | $674,020 | $224,600 | $449,420 |
| 2017 | $7,185 | $638,700 | $224,600 | $414,100 |
| 2016 | $7,025 | $613,580 | $0 | $0 |
| 2015 | $7,103 | $401,240 | $0 | $401,240 |
| 2014 | $6,954 | $394,060 | $0 | $394,060 |
Source: Public Records
Map
Nearby Homes
- 43785 Transit Square
- 43812 Middleway Terrace
- Hayes Plan at Ashburn Station
- Addison Homesite Special Plan at Ashburn Station
- 43791 Metro Terrace Unit B
- Addison Plan at Ashburn Station
- 43789 Metro Terrace Unit A
- 43730 Transit Square
- 21825 Express Terrace Unit 110
- 21799 Express Terrace Unit 1122A
- 21795 Express Terrace Unit 1124
- 21789 Express Terrace
- 21787 Express Terrace
- 21787 Express Terrace Unit 1128A
- 21783 Express Terrace Unit 1129A
- 43769 Metro Terrace
- Elsdon Plan at Waxpool Crossing - The Flats
- Alverton Plan at Waxpool Crossing - The Flats
- Bellister Plan at Waxpool Crossing - The Flats
- Farleigh Plan at Waxpool Crossing - The Flats
- 21887 Hyde Park Dr
- 21895 Hyde Park Dr
- 21883 Hyde Park Dr
- 21899 Hyde Park Dr
- 21907 Hyde Park Dr
- 21890 Hyde Park Dr
- 21879 Hyde Park Dr
- 21894 Hyde Park Dr
- 21886 Hyde Park Dr
- 21911 Hyde Park Dr
- 21898 Hyde Park Dr
- 21882 Hyde Park Dr
- 21915 Hyde Park Dr
- 21902 Hyde Park Dr
- 21871 Hyde Park Dr
- 21919 Hyde Park Dr
- 21906 Hyde Park Dr
- 21910 Hyde Park Dr
- 21867 Hyde Park Dr
- 21923 Hyde Park Dr