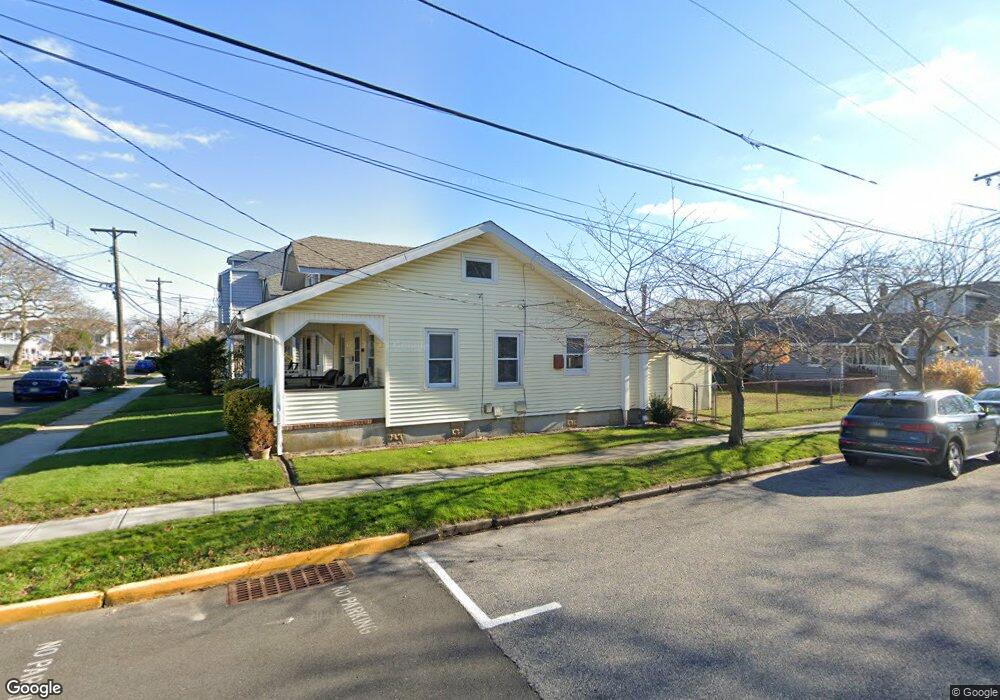
219 12th Ave Unit 5 Belmar, NJ 07719
Estimated Value: $518,000 - $994,000
2
Beds
1
Bath
456
Sq Ft
$1,539/Sq Ft
Est. Value
About This Home
This home is located at 219 12th Ave Unit 5, Belmar, NJ 07719 and is currently estimated at $701,967, approximately $1,539 per square foot. 219 12th Ave Unit 5 is a home located in Monmouth County with nearby schools including Belmar Elementary School, St. Rose Grammar School, and St Rose High School.
Ownership History
Date
Name
Owned For
Owner Type
Purchase Details
Closed on
May 13, 2019
Sold by
Castelli Bruce and Borelli Linda
Bought by
Borelli Linda
Current Estimated Value
Purchase Details
Closed on
May 22, 2007
Sold by
Castelli Bruce and Borelli Linda
Bought by
Castelli Vilma
Purchase Details
Closed on
May 21, 2007
Sold by
Castelli Vilma
Bought by
Castelli Bruce and Borelli Linda
Purchase Details
Closed on
Jun 19, 1995
Sold by
Delpriore Roseann
Bought by
Castelli Victor
Create a Home Valuation Report for This Property
The Home Valuation Report is an in-depth analysis detailing your home's value as well as a comparison with similar homes in the area
Home Values in the Area
Average Home Value in this Area
Purchase History
| Date | Buyer | Sale Price | Title Company |
|---|---|---|---|
| Borelli Linda | -- | None Available | |
| Castelli Vilma | -- | None Available | |
| Castelli Bruce | -- | None Available | |
| Castelli Victor | $50,000 | -- |
Source: Public Records
Tax History Compared to Growth
Tax History
| Year | Tax Paid | Tax Assessment Tax Assessment Total Assessment is a certain percentage of the fair market value that is determined by local assessors to be the total taxable value of land and additions on the property. | Land | Improvement |
|---|---|---|---|---|
| 2025 | $6,012 | $413,200 | $361,300 | $51,900 |
| 2024 | $5,810 | $413,200 | $361,300 | $51,900 |
| 2023 | $5,810 | $413,200 | $361,300 | $51,900 |
| 2022 | $5,607 | $413,200 | $361,300 | $51,900 |
| 2021 | $5,607 | $413,200 | $361,300 | $51,900 |
| 2020 | $5,558 | $413,200 | $361,300 | $51,900 |
| 2019 | $5,558 | $413,200 | $361,300 | $51,900 |
| 2018 | $5,103 | $413,200 | $361,300 | $51,900 |
| 2017 | $4,979 | $413,200 | $361,300 | $51,900 |
| 2016 | $5,137 | $268,800 | $210,000 | $58,800 |
| 2015 | $4,774 | $248,800 | $190,000 | $58,800 |
| 2014 | $4,427 | $228,800 | $170,000 | $58,800 |
Source: Public Records
Map
Nearby Homes