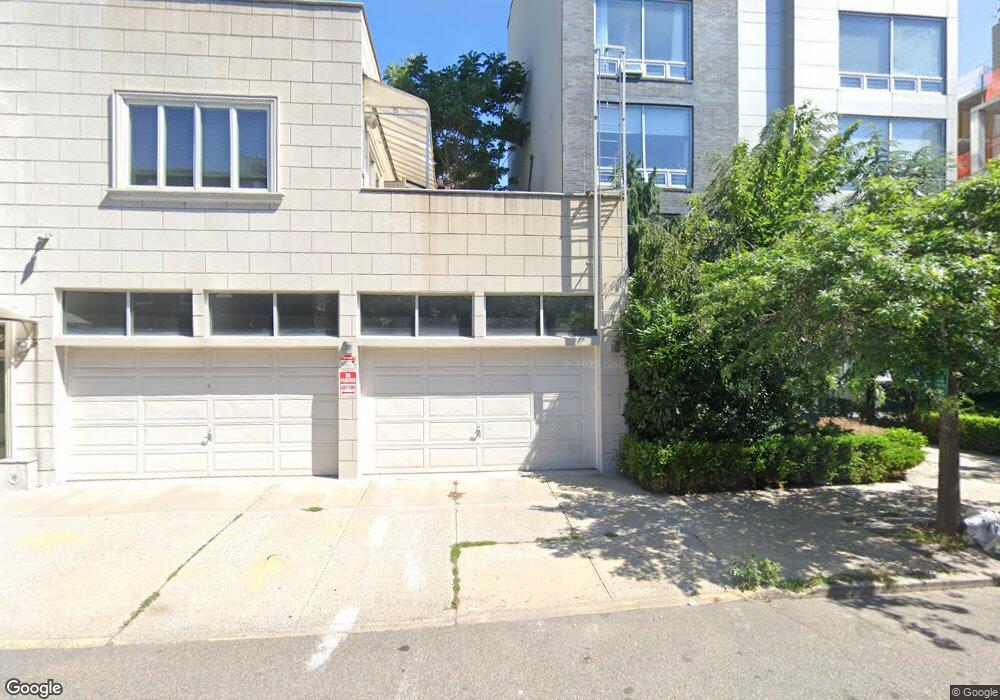
219-223 Withers St Unit 3A Brooklyn, NY 11211
Williamsburg NeighborhoodEstimated Value: $1,186,143 - $1,459,000
--
Bed
--
Bath
999
Sq Ft
$1,292/Sq Ft
Est. Value
About This Home
This home is located at 219-223 Withers St Unit 3A, Brooklyn, NY 11211 and is currently estimated at $1,290,286, approximately $1,291 per square foot. 219-223 Withers St Unit 3A is a home located in Kings County with nearby schools including P.S. 132 The Conselyea School, Success Academy Charter School-NYC 9, and MESA Charter High School.
Ownership History
Date
Name
Owned For
Owner Type
Purchase Details
Closed on
Jun 6, 2023
Sold by
Jennifer Kim Trust Dated April 4 2019 and Kim Jennifer As Trustee
Bought by
Honest Answerly Llc
Current Estimated Value
Purchase Details
Closed on
Jun 18, 2019
Sold by
Kim Jennifer
Bought by
Jennifer Kim Trust Dated /19 and Jennifer Kim As Trustee
Purchase Details
Closed on
Oct 12, 2010
Sold by
Haeyoung Kim Kristen and Kim Jennifer
Bought by
Kim Jennifer
Home Financials for this Owner
Home Financials are based on the most recent Mortgage that was taken out on this home.
Original Mortgage
$6,890
Interest Rate
4.17%
Mortgage Type
Purchase Money Mortgage
Purchase Details
Closed on
Nov 6, 2007
Sold by
221 Withers St Llc
Bought by
Kim Jennifer and Kim Kristen Haeyoung
Create a Home Valuation Report for This Property
The Home Valuation Report is an in-depth analysis detailing your home's value as well as a comparison with similar homes in the area
Home Values in the Area
Average Home Value in this Area
Purchase History
| Date | Buyer | Sale Price | Title Company |
|---|---|---|---|
| Honest Answerly Llc | -- | -- | |
| Jennifer Kim Trust Dated /19 | -- | -- | |
| Kim Jennifer | -- | -- | |
| Kim Jennifer | $661,862 | -- |
Source: Public Records
Mortgage History
| Date | Status | Borrower | Loan Amount |
|---|---|---|---|
| Previous Owner | Kim Jennifer | $6,890 |
Source: Public Records
Tax History Compared to Growth
Tax History
| Year | Tax Paid | Tax Assessment Tax Assessment Total Assessment is a certain percentage of the fair market value that is determined by local assessors to be the total taxable value of land and additions on the property. | Land | Improvement |
|---|---|---|---|---|
| 2025 | $12,768 | $148,240 | $7,576 | $140,664 |
| 2024 | $12,768 | $141,856 | $7,576 | $134,280 |
| 2023 | $11,448 | $125,977 | $7,576 | $118,401 |
| 2022 | $8,533 | $120,455 | $7,576 | $112,879 |
| 2021 | $5,336 | $72,466 | $7,576 | $64,890 |
| 2020 | $4,062 | $83,340 | $7,576 | $75,764 |
| 2019 | $2,037 | $83,917 | $7,576 | $76,341 |
| 2018 | $178 | $79,458 | $7,575 | $71,883 |
| 2017 | $178 | $75,064 | $7,576 | $67,488 |
| 2016 | $181 | $74,775 | $7,576 | $67,199 |
| 2015 | $141 | $62,457 | $9,383 | $53,074 |
| 2014 | $141 | $59,153 | $7,576 | $51,577 |
Source: Public Records
Map
Nearby Homes
- 456 Humboldt St
- 219 Withers St Unit 1B
- 447 Humboldt St
- 229 Withers St Unit 2D
- 229 Withers St Unit 1A
- 229 Withers St Unit 1B
- 229 Withers St Unit 4A
- 229 Withers St Unit 3A
- 229 Withers St Unit 4C
- 229 Withers St Unit 4B
- 229 Withers St Unit 5A
- 229 Withers St Unit 3C
- 229 Withers St Unit 3D
- 229 Withers St Unit 3B
- 229 Withers St Unit 2A
- 229 Withers St Unit 2B
- 446 Humboldt St Unit 1
- 204 Withers St Unit 4-B
- 204 Withers St Unit 2-A
- 438 Humboldt St Unit 3-B
- 219-223 Withers St Unit 5B
- 219-223 Withers St Unit 6B/PH
- 219-223 Withers St Unit 5A
- 219-223 Withers St Unit 3B
- 219-223 Withers St Unit 2B
- 219-223 Withers St Unit 1A
- 219-223 Withers St Unit 4B
- 219-223 Withers St Unit 2A
- 219-223 Withers St Unit 4A
- 219-223 Withers St Unit 6A
- 219-223 Withers St
- 219-223 Withers St Unit 1B
- 219 Withers St Unit 223
- 219 Withers St Unit 6A223
- 219 Withers St Unit 5B223
- 219 Withers St Unit 5A223
- 219 Withers St Unit 4B223
- 219 Withers St Unit 4A223
- 219 Withers St Unit 3B223
- 219 Withers St Unit 3A223