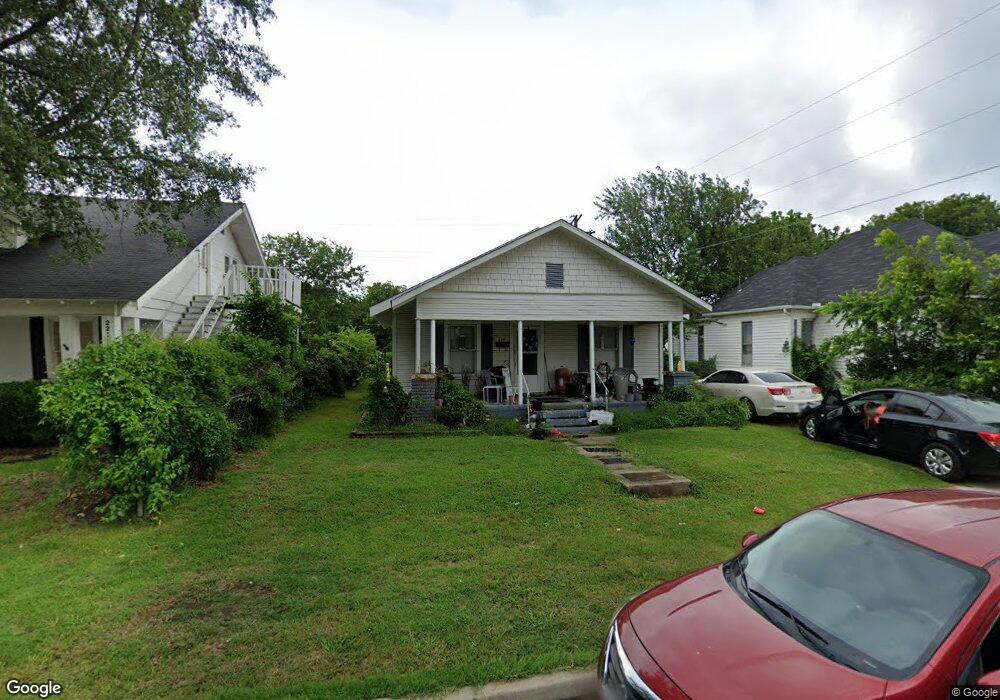
219 3rd Ave NW Ardmore, OK 73401
Estimated Value: $73,000 - $108,697
3
Beds
1
Bath
1,286
Sq Ft
$73/Sq Ft
Est. Value
About This Home
This home is located at 219 3rd Ave NW, Ardmore, OK 73401 and is currently estimated at $93,424, approximately $72 per square foot. 219 3rd Ave NW is a home located in Carter County with nearby schools including Lincoln Elementary School, Ardmore Middle School, and Ardmore High School.
Ownership History
Date
Name
Owned For
Owner Type
Purchase Details
Closed on
May 23, 2023
Sold by
Clardy Ted
Bought by
Clardy Ted and Clardy Caroline
Current Estimated Value
Purchase Details
Closed on
Feb 22, 2023
Sold by
Bigg Sky Rentals Llc
Bought by
Clardy Ted and Clardy Caroline
Purchase Details
Closed on
Jul 16, 2008
Sold by
Roach Donna E
Bought by
Progeny Investment Properties Llc
Home Financials for this Owner
Home Financials are based on the most recent Mortgage that was taken out on this home.
Original Mortgage
$38,422
Interest Rate
6.09%
Mortgage Type
Future Advance Clause Open End Mortgage
Purchase Details
Closed on
Mar 11, 2003
Sold by
Love Thomas A Or Sherri Y
Bought by
Vaughan Carl J and Vaughan Sharon
Purchase Details
Closed on
Aug 28, 1997
Sold by
Carter W K
Bought by
Love Thomas A and Love Yvett
Create a Home Valuation Report for This Property
The Home Valuation Report is an in-depth analysis detailing your home's value as well as a comparison with similar homes in the area
Purchase History
| Date | Buyer | Sale Price | Title Company |
|---|---|---|---|
| Clardy Ted | -- | None Listed On Document | |
| Clardy Ted | -- | None Listed On Document | |
| Clardy Ted | -- | None Listed On Document | |
| Clardy Ted | -- | Stewart Abstract & Title | |
| Progeny Investment Properties Llc | $33,000 | -- | |
| Vaughan Carl J | $28,000 | -- | |
| Love Thomas A | $24,000 | -- |
Source: Public Records
Mortgage History
| Date | Status | Borrower | Loan Amount |
|---|---|---|---|
| Previous Owner | Progeny Investment Properties Llc | $38,422 |
Source: Public Records
Tax History
| Year | Tax Paid | Tax Assessment Tax Assessment Total Assessment is a certain percentage of the fair market value that is determined by local assessors to be the total taxable value of land and additions on the property. | Land | Improvement |
|---|---|---|---|---|
| 2025 | $810 | $8,122 | $896 | $7,226 |
| 2024 | $811 | $7,736 | $854 | $6,882 |
| 2023 | $772 | $7,368 | $845 | $6,523 |
| 2022 | $671 | $7,016 | $831 | $6,185 |
| 2021 | $674 | $6,682 | $799 | $5,883 |
| 2020 | $633 | $6,364 | $720 | $5,644 |
| 2019 | $589 | $6,062 | $720 | $5,342 |
| 2018 | $570 | $5,773 | $720 | $5,053 |
| 2017 | $503 | $5,498 | $720 | $4,778 |
| 2016 | $488 | $5,236 | $720 | $4,516 |
| 2015 | $395 | $5,136 | $190 | $4,946 |
| 2014 | $438 | $4,892 | $190 | $4,702 |
Source: Public Records
Map
Nearby Homes
Your Personal Tour Guide
Ask me questions while you tour the home.