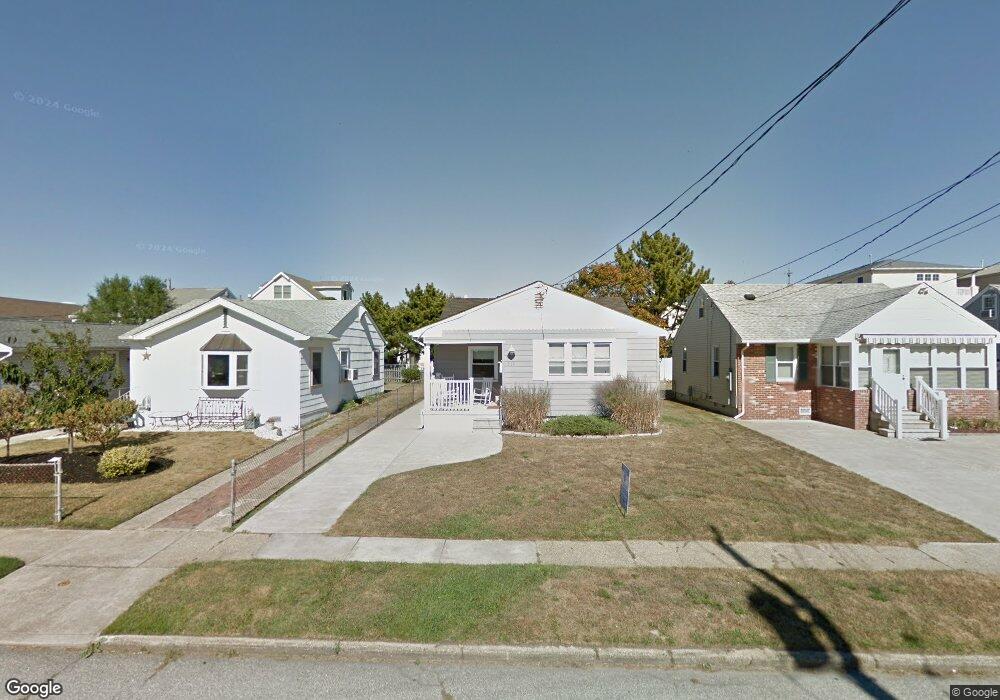
219 5th St S Brigantine, NJ 08203
Estimated Value: $656,038 - $845,000
4
Beds
2
Baths
1,514
Sq Ft
$504/Sq Ft
Est. Value
About This Home
This home is located at 219 5th St S, Brigantine, NJ 08203 and is currently estimated at $762,510, approximately $503 per square foot. 219 5th St S is a home located in Atlantic County with nearby schools including Brigantine Community School and Brigantine Elementary School.
Ownership History
Date
Name
Owned For
Owner Type
Purchase Details
Closed on
Sep 13, 2017
Sold by
Thesing Denis and Forgach Kathryn
Bought by
Smith Gregg A and Smith Gloria Ann
Current Estimated Value
Home Financials for this Owner
Home Financials are based on the most recent Mortgage that was taken out on this home.
Original Mortgage
$272,000
Outstanding Balance
$227,322
Interest Rate
3.93%
Mortgage Type
New Conventional
Estimated Equity
$535,188
Purchase Details
Closed on
Aug 30, 2004
Sold by
Howley Michael J and Rossi Donna M
Bought by
Thesing Denis M and Forgach Kathryn
Home Financials for this Owner
Home Financials are based on the most recent Mortgage that was taken out on this home.
Original Mortgage
$100,000
Interest Rate
6.02%
Mortgage Type
Purchase Money Mortgage
Purchase Details
Closed on
Nov 24, 1998
Sold by
Schwartz Sidney and Cohen Bernard
Bought by
Howley Michael J and Rossi Donna M
Home Financials for this Owner
Home Financials are based on the most recent Mortgage that was taken out on this home.
Original Mortgage
$110,700
Interest Rate
6.85%
Create a Home Valuation Report for This Property
The Home Valuation Report is an in-depth analysis detailing your home's value as well as a comparison with similar homes in the area
Home Values in the Area
Average Home Value in this Area
Purchase History
| Date | Buyer | Sale Price | Title Company |
|---|---|---|---|
| Smith Gregg A | $340,000 | None Available | |
| Thesing Denis M | $430,000 | Quality Title | |
| Howley Michael J | $123,000 | Pilgrim Title Agency |
Source: Public Records
Mortgage History
| Date | Status | Borrower | Loan Amount |
|---|---|---|---|
| Open | Smith Gregg A | $272,000 | |
| Previous Owner | Thesing Denis M | $100,000 | |
| Previous Owner | Howley Michael J | $110,700 |
Source: Public Records
Tax History Compared to Growth
Tax History
| Year | Tax Paid | Tax Assessment Tax Assessment Total Assessment is a certain percentage of the fair market value that is determined by local assessors to be the total taxable value of land and additions on the property. | Land | Improvement |
|---|---|---|---|---|
| 2025 | $6,008 | $319,600 | $221,000 | $98,600 |
| 2024 | $6,008 | $319,600 | $221,000 | $98,600 |
| 2023 | $5,551 | $319,600 | $221,000 | $98,600 |
| 2022 | $5,551 | $319,600 | $221,000 | $98,600 |
| 2021 | $5,452 | $319,600 | $221,000 | $98,600 |
| 2020 | $5,395 | $319,600 | $221,000 | $98,600 |
| 2019 | $5,359 | $314,700 | $221,000 | $93,700 |
| 2018 | $5,466 | $314,700 | $221,000 | $93,700 |
| 2017 | $5,554 | $314,700 | $221,000 | $93,700 |
| 2016 | $5,551 | $314,700 | $221,000 | $93,700 |
| 2015 | $5,580 | $314,700 | $221,000 | $93,700 |
| 2014 | $5,372 | $314,700 | $221,000 | $93,700 |
Source: Public Records
Map
Nearby Homes
- 136 5th St S
- 159 Sheridan Square
- 223 8th St S
- 222 8th St S
- 321 6th St S Unit 2
- 321 6th St S Unit 14
- 321 6th St S Unit 1
- 321 6th St S Unit 16
- 321 6th St S Unit 8
- 321 6th St S Unit 4
- 800 W Brigantine Ave Unit 217
- 150 9th St S
- 900 W Brigantine Ave
- 6th Rum Point Ct
- 1000 W Brigantine Ave Unit 4
- 303 Lafayette Place
- 250 11th St S
- 114 E Brigantine Ave Unit B
- 202 E Brigantine Ave
- 116 Bayshore Ave
- 215 5th St S
- 223 5th St S
- 227 5th St S
- 201 5th St S
- 201 5th St S Unit 3
- 201 5th St S Unit 4
- 201 5th St S Unit APARTMENT
- 218 4th St S
- 222 4th St S
- 214 4th St S
- 231 5th St S
- 226 4th St S
- 210 4th St S
- 230 4th St S
- 235 5th St S
- 206 4th St S Unit B
- 206 4th St S Unit A
- 206 4th St S
- 206 4th St S
- 222 5th St S