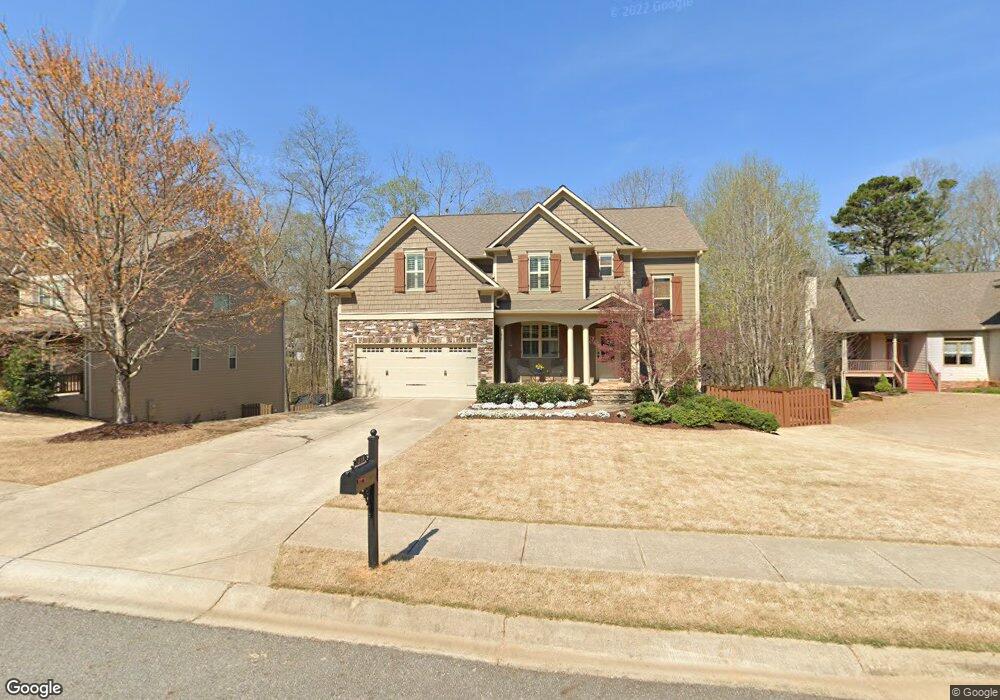
219 Abernathy Way Unit 51 Acworth, GA 30102
Oak Grove NeighborhoodEstimated Value: $569,000 - $581,035
5
Beds
3
Baths
2,450
Sq Ft
$235/Sq Ft
Est. Value
About This Home
This home is located at 219 Abernathy Way Unit 51, Acworth, GA 30102 and is currently estimated at $575,018, approximately $234 per square foot. 219 Abernathy Way Unit 51 is a home located in Cherokee County with nearby schools including Oak Grove Elementary School, E. T. Booth Middle School, and Etowah High School.
Ownership History
Date
Name
Owned For
Owner Type
Purchase Details
Closed on
Oct 19, 2017
Sold by
Laney Matthew C
Bought by
Alexander Douglas W and Alexander Diane L
Current Estimated Value
Home Financials for this Owner
Home Financials are based on the most recent Mortgage that was taken out on this home.
Original Mortgage
$120,000
Outstanding Balance
$100,019
Interest Rate
3.83%
Mortgage Type
New Conventional
Estimated Equity
$474,999
Purchase Details
Closed on
Feb 10, 2012
Sold by
J & M Custom Homes Llc
Bought by
Laney Matthew C and Laney Julie P
Home Financials for this Owner
Home Financials are based on the most recent Mortgage that was taken out on this home.
Original Mortgage
$207,000
Interest Rate
3.91%
Mortgage Type
New Conventional
Purchase Details
Closed on
Aug 17, 2011
Sold by
Turnman Properties Inc
Bought by
J
Create a Home Valuation Report for This Property
The Home Valuation Report is an in-depth analysis detailing your home's value as well as a comparison with similar homes in the area
Home Values in the Area
Average Home Value in this Area
Purchase History
| Date | Buyer | Sale Price | Title Company |
|---|---|---|---|
| Alexander Douglas W | $368,000 | -- | |
| Laney Matthew C | $230,000 | -- | |
| J | $49,100 | -- |
Source: Public Records
Mortgage History
| Date | Status | Borrower | Loan Amount |
|---|---|---|---|
| Open | Alexander Douglas W | $120,000 | |
| Previous Owner | Laney Matthew C | $207,000 |
Source: Public Records
Tax History Compared to Growth
Tax History
| Year | Tax Paid | Tax Assessment Tax Assessment Total Assessment is a certain percentage of the fair market value that is determined by local assessors to be the total taxable value of land and additions on the property. | Land | Improvement |
|---|---|---|---|---|
| 2025 | $1,237 | $214,160 | $36,000 | $178,160 |
| 2024 | $1,536 | $218,440 | $40,000 | $178,440 |
| 2023 | $1,419 | $228,240 | $40,000 | $188,240 |
| 2022 | $1,127 | $174,880 | $27,200 | $147,680 |
| 2021 | $1,159 | $158,880 | $27,200 | $131,680 |
| 2020 | $1,112 | $145,040 | $27,200 | $117,840 |
| 2019 | $4,190 | $154,640 | $24,000 | $130,640 |
| 2018 | $3,759 | $138,360 | $28,800 | $109,560 |
| 2017 | $3,169 | $284,600 | $24,000 | $89,840 |
| 2016 | $3,169 | $272,100 | $22,000 | $86,840 |
| 2015 | $2,913 | $247,700 | $19,200 | $79,880 |
| 2014 | $2,540 | $215,600 | $18,000 | $68,240 |
Source: Public Records
Map
Nearby Homes
- 6147 Little Ridge Rd
- 6155 Little Ridge Rd
- 6137 Little Ridge Rd
- 517 Rendezvous Rd
- 536 Rendezvous Rd
- 320 Oak Leaf Place
- 503 Rendezvous Rd
- 153 Centennial Ridge Dr
- 6222 Westridge Trace
- 6226 Westridge Trace
- 240 Ridge Mill Dr
- Bolton Plan at Cherokee Township
- Brooks Plan at Cherokee Township
- Bryson Plan at Cherokee Township
- 577 Oakside Place
- 440 Carrera Ln
- 435 Carrera Ln
- 325 Colsen Dr
- 432 Carrera Ln
- 206 Cameron Ct
- 219 Abernathy Way
- 221 Abernathy Way
- 0 Abernathy Way Unit 7015743
- 0 Abernathy Way Unit 8868048
- 0 Abernathy Way Unit 7219683
- 0 Abernathy Way Unit 7468268
- 0 Abernathy Way Unit 8013660
- 217 Abernathy Way Unit 50
- 217 Abernathy Way
- 223 Abernathy Way
- 215 Abernathy Way
- 215 Abernathy Way Unit 49
- 120 Sundown Way
- 213 Abernathy Way
- 2317 Westland Mill
- 222 Abernathy Way
- 216 Abernathy Way Unit 57
- 216 Abernathy Way
- 218 Abernathy Way
- 214 Abernathy Way Unit 58