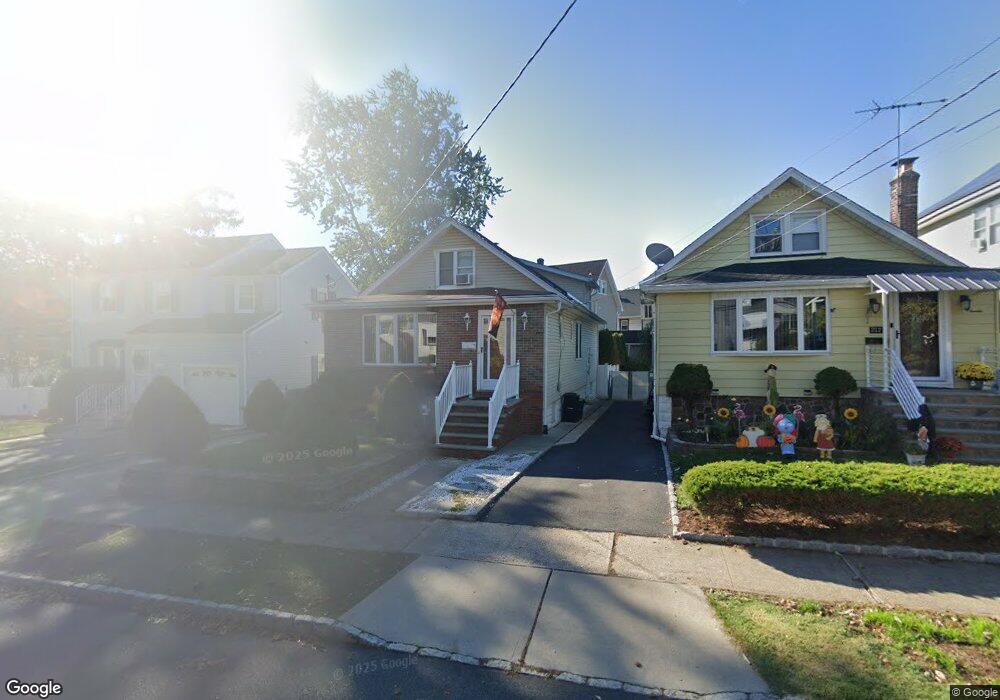
219 Baldwin St Bloomfield, NJ 07003
Estimated Value: $356,000 - $555,000
Studio
--
Bath
956
Sq Ft
$472/Sq Ft
Est. Value
About This Home
This home is located at 219 Baldwin St, Bloomfield, NJ 07003 and is currently estimated at $451,038, approximately $471 per square foot. 219 Baldwin St is a home located in Essex County with nearby schools including Franklin School, Bloomfield Middle School, and Bloomfield High School.
Ownership History
Date
Name
Owned For
Owner Type
Purchase Details
Closed on
Sep 28, 2011
Sold by
Gonnella Peter and Gonnella Theresa
Bought by
Gonnella Theresa and Gonnella Peter
Current Estimated Value
Create a Home Valuation Report for This Property
The Home Valuation Report is an in-depth analysis detailing your home's value as well as a comparison with similar homes in the area
Home Values in the Area
Average Home Value in this Area
Purchase History
| Date | Buyer | Sale Price | Title Company |
|---|---|---|---|
| Gonnella Theresa | -- | Land Title Agency Inc |
Source: Public Records
Tax History
| Year | Tax Paid | Tax Assessment Tax Assessment Total Assessment is a certain percentage of the fair market value that is determined by local assessors to be the total taxable value of land and additions on the property. | Land | Improvement |
|---|---|---|---|---|
| 2025 | $11,095 | $339,500 | $128,100 | $211,400 |
| 2024 | $11,095 | $339,500 | $128,100 | $211,400 |
| 2022 | $10,871 | $339,500 | $128,100 | $211,400 |
| 2021 | $10,670 | $339,500 | $128,100 | $211,400 |
| 2020 | $10,508 | $339,500 | $128,100 | $211,400 |
| 2019 | $8,945 | $224,700 | $127,000 | $97,700 |
| 2018 | $8,907 | $224,700 | $127,000 | $97,700 |
| 2017 | $8,772 | $224,700 | $127,000 | $97,700 |
| 2016 | $8,423 | $224,700 | $127,000 | $97,700 |
| 2015 | $8,345 | $224,700 | $127,000 | $97,700 |
| 2014 | $8,187 | $224,700 | $127,000 | $97,700 |
Source: Public Records
Map
Nearby Homes
- 46 Summit Ave
- 10 E Passaic Ave
- 378 Hoover Ave Unit 149
- 366 Hoover Ave Unit 119
- 348 Hoover Ave Unit 92
- 290 Hoover Ave
- 290 Hoover Ave Unit 9
- 10 Almira St Unit 14
- 10 14almira St
- 28 Forest Dr
- 39 Forest Dr
- 41 Woodland Rd
- 39 Woodland Rd
- 117 Hoover Ave
- 58 Osborne St
- 48 Broughton Ave
- 48 Broughton Ave Unit 2
- 129 Pake St
- 54 Broughton Ave
- 152 Belleville Ave Unit 1
Your Personal Tour Guide
Ask me questions while you tour the home.