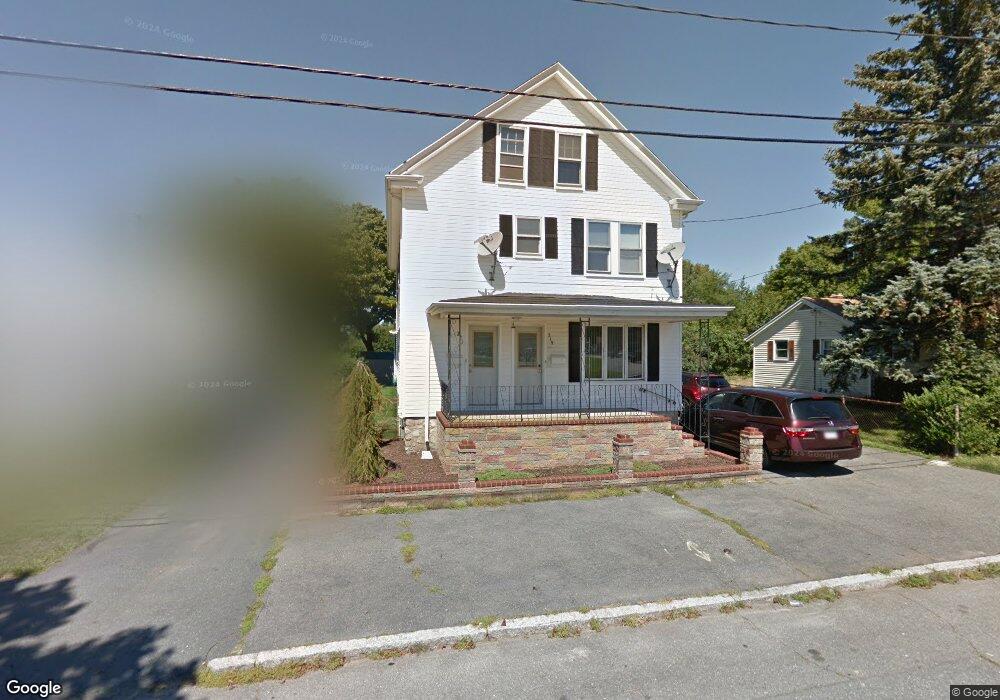
219 Buchanan St Unit 221 New Bedford, MA 02746
Riverside Park NeighborhoodEstimated Value: $400,000 - $585,000
5
Beds
2
Baths
2,524
Sq Ft
$205/Sq Ft
Est. Value
About This Home
This home is located at 219 Buchanan St Unit 221, New Bedford, MA 02746 and is currently estimated at $517,151, approximately $204 per square foot. 219 Buchanan St Unit 221 is a home located in Bristol County with nearby schools including Carlos Pacheco Elementary School, Keith Middle School, and New Bedford High School.
Ownership History
Date
Name
Owned For
Owner Type
Purchase Details
Closed on
Aug 23, 2006
Sold by
Faria Edward B and Faria Ursulina
Bought by
Faria Edgar
Current Estimated Value
Home Financials for this Owner
Home Financials are based on the most recent Mortgage that was taken out on this home.
Original Mortgage
$60,000
Interest Rate
6.54%
Create a Home Valuation Report for This Property
The Home Valuation Report is an in-depth analysis detailing your home's value as well as a comparison with similar homes in the area
Home Values in the Area
Average Home Value in this Area
Purchase History
| Date | Buyer | Sale Price | Title Company |
|---|---|---|---|
| Faria Edgar | -- | -- | |
| Faria Edgar | -- | -- |
Source: Public Records
Mortgage History
| Date | Status | Borrower | Loan Amount |
|---|---|---|---|
| Open | Faria Edgar | $135,000 | |
| Closed | Faria Edgar | $60,000 |
Source: Public Records
Tax History Compared to Growth
Tax History
| Year | Tax Paid | Tax Assessment Tax Assessment Total Assessment is a certain percentage of the fair market value that is determined by local assessors to be the total taxable value of land and additions on the property. | Land | Improvement |
|---|---|---|---|---|
| 2025 | $5,675 | $501,800 | $116,900 | $384,900 |
| 2024 | $5,100 | $425,000 | $121,000 | $304,000 |
| 2023 | $4,787 | $335,000 | $96,800 | $238,200 |
| 2022 | $4,361 | $280,600 | $92,700 | $187,900 |
| 2021 | $4,312 | $276,600 | $88,700 | $187,900 |
| 2020 | $4,152 | $256,900 | $88,700 | $168,200 |
| 2019 | $4,070 | $247,100 | $88,700 | $158,400 |
| 2018 | $3,830 | $230,300 | $88,700 | $141,600 |
| 2017 | $3,411 | $204,400 | $84,700 | $119,700 |
| 2016 | $3,216 | $195,000 | $80,700 | $114,300 |
| 2015 | $3,008 | $191,200 | $80,700 | $110,500 |
| 2014 | $2,938 | $193,800 | $82,700 | $111,100 |
Source: Public Records
Map
Nearby Homes
- 177 Buchanan St
- 28 Harvard St
- 100 Peckham St
- 498-500 Coggeshall St
- 71 Highland St
- 70-72 Highland St
- 96 Mount Pleasant St
- 69 Mount Pleasant St
- 81 Durfee St
- 20 Lafrance Ct
- 193 Ashley Blvd
- 161 Deane St
- 70 Trinity St
- 212 Weld St
- 178 Ashley Blvd
- 9 Clark St
- 24 Acorn St
- 190 Weld St
- 301 Davis St
- 98 Beetle St
- 225 Buchanan St
- 213 Buchanan St
- 233 Buchanan St
- 205 Buchanan St Unit 207
- 201 Buchanan St Unit 203
- 295 Highland St
- 305 Highland St
- 293 Highland St
- 279 Highland St
- 309 Mount Pleasant St
- 303 Mount Pleasant St
- 273 Highland St
- 273 1/2 Highland St
- 273 Highland St
- 264 Loftus St
- 257 Loftus St
- 294 Mount Pleasant St
- 269 Highland St
- 302 Mount Pleasant St
- 306 Mount Pleasant St