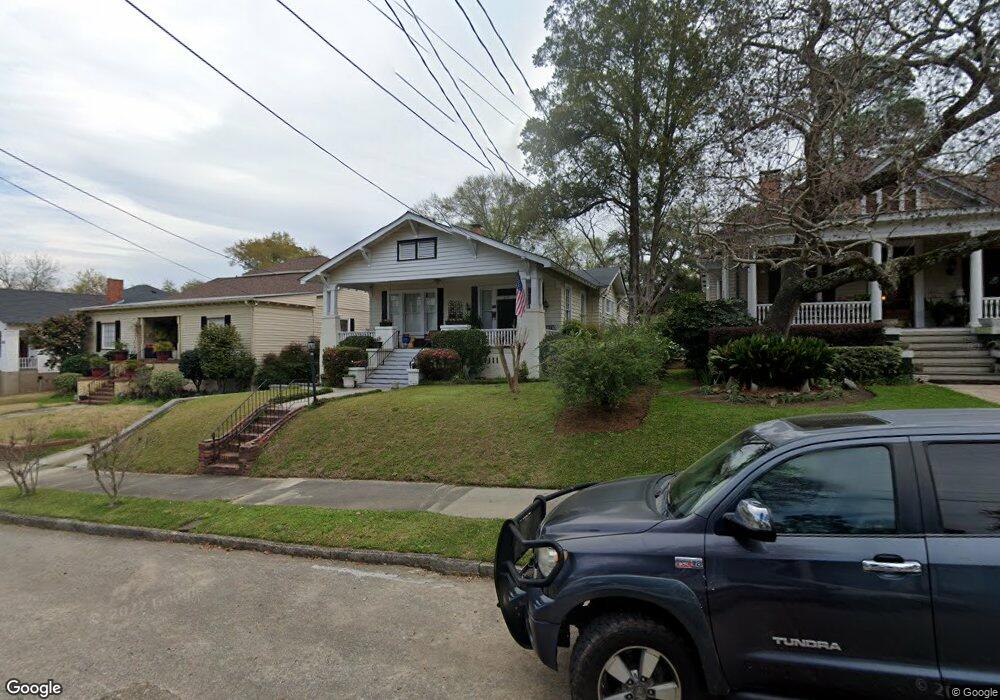
219 Buford Place Macon, GA 31204
Vineville Historic District NeighborhoodEstimated Value: $239,000 - $321,000
3
Beds
2
Baths
2,121
Sq Ft
$129/Sq Ft
Est. Value
About This Home
This home is located at 219 Buford Place, Macon, GA 31204 and is currently estimated at $272,704, approximately $128 per square foot. 219 Buford Place is a home with nearby schools including Rosa Taylor Elementary School, Miller Fine Arts Magnet Middle School, and Central High School.
Ownership History
Date
Name
Owned For
Owner Type
Purchase Details
Closed on
Dec 18, 2015
Sold by
Wilson Frank J
Bought by
Yarbrough Amber B
Current Estimated Value
Home Financials for this Owner
Home Financials are based on the most recent Mortgage that was taken out on this home.
Original Mortgage
$124,650
Outstanding Balance
$98,671
Interest Rate
3.98%
Mortgage Type
New Conventional
Estimated Equity
$174,033
Purchase Details
Closed on
Dec 21, 2010
Sold by
Federal Home Loan Mortgage Corporation
Bought by
Wilson Frank J
Home Financials for this Owner
Home Financials are based on the most recent Mortgage that was taken out on this home.
Original Mortgage
$99,384
Interest Rate
4.42%
Mortgage Type
FHA
Purchase Details
Closed on
Sep 7, 2010
Sold by
Bac Home Loans Servicing Lp
Bought by
Federal Home Loan Mortgage Corp
Purchase Details
Closed on
Sep 15, 1998
Bought by
Rice Stephen R and Rice Sarah K
Create a Home Valuation Report for This Property
The Home Valuation Report is an in-depth analysis detailing your home's value as well as a comparison with similar homes in the area
Home Values in the Area
Average Home Value in this Area
Purchase History
| Date | Buyer | Sale Price | Title Company |
|---|---|---|---|
| Yarbrough Amber B | $138,500 | -- | |
| Wilson Frank J | $72,000 | None Available | |
| Federal Home Loan Mortgage Corp | $109,636 | None Available | |
| Bac Home Loans Servicing Lp | $109,635 | None Available | |
| Rice Stephen R | $96,500 | -- |
Source: Public Records
Mortgage History
| Date | Status | Borrower | Loan Amount |
|---|---|---|---|
| Open | Yarbrough Amber B | $124,650 | |
| Previous Owner | Wilson Frank J | $99,384 |
Source: Public Records
Tax History
| Year | Tax Paid | Tax Assessment Tax Assessment Total Assessment is a certain percentage of the fair market value that is determined by local assessors to be the total taxable value of land and additions on the property. | Land | Improvement |
|---|---|---|---|---|
| 2025 | $1,553 | $70,201 | $12,600 | $57,601 |
| 2024 | $1,605 | $70,201 | $12,600 | $57,601 |
| 2023 | $1,090 | $67,900 | $12,600 | $55,300 |
| 2022 | $2,218 | $71,060 | $14,212 | $56,848 |
| 2021 | $2,095 | $62,140 | $13,644 | $48,496 |
| 2020 | $2,011 | $58,799 | $13,644 | $45,155 |
| 2019 | $1,897 | $55,458 | $13,644 | $41,814 |
| 2018 | $2,985 | $53,788 | $13,644 | $40,144 |
| 2017 | $2,015 | $53,788 | $13,644 | $40,144 |
| 2016 | $1,861 | $53,788 | $13,644 | $40,144 |
| 2015 | $2,215 | $45,227 | $13,644 | $31,584 |
| 2014 | $2,547 | $45,227 | $13,644 | $31,584 |
Source: Public Records
Map
Nearby Homes
- 230 Calloway Dr
- 155 Calloway Dr
- 172 Hines Terrace
- 216 Hines Terrace
- 227 Corbin Ave
- 175 Corbin Ave Unit B
- 175 Corbin Ave Unit E
- 175 Corbin Ave Unit A
- 175 Corbin Ave Unit E
- 175 Corbin Ave Unit A
- 175 Ave Unit B
- 173 Pierce Ave
- 215 Pierce Ave
- 218 Rogers Ave
- 362 Buford Place
- 133 Stonewall Place
- 173 Cleveland Ave
- 127 Rogers Ave
- 124 Stonewall Place
- 171 Pio Nono Ave
- 211 Buford Place
- 227 Buford Place
- 235 Buford Place
- 203 Buford Place
- 243 Buford Place
- 222 Buford Place
- 230 Buford Place
- 206 Buford Place
- 214 Buford Place
- 193 Buford Place
- 251 Buford Place
- 238 Buford Place
- 196 Buford Place
- 246 Buford Place
- 187 Buford Place
- 259 Buford Place
- 218 Calloway Dr
- 2455 Clayton St
- 2470 Clayton St
- 254 Buford Place
Your Personal Tour Guide
Ask me questions while you tour the home.