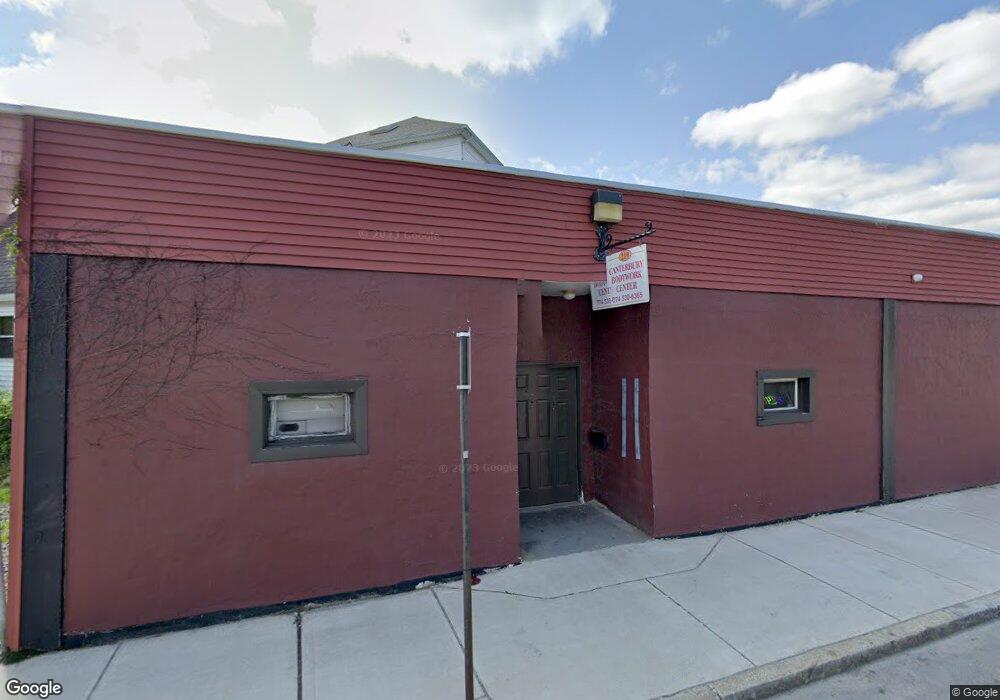
219 Canterbury St Worcester, MA 01603
South Worcester NeighborhoodEstimated Value: $420,917
--
Bed
--
Bath
5,799
Sq Ft
$73/Sq Ft
Est. Value
About This Home
This home is located at 219 Canterbury St, Worcester, MA 01603 and is currently estimated at $420,917, approximately $72 per square foot. 219 Canterbury St is a home located in Worcester County with nearby schools including Jacob Hiatt Magnet School, Chandler Magnet, and University Park Campus School.
Ownership History
Date
Name
Owned For
Owner Type
Purchase Details
Closed on
Nov 22, 2016
Sold by
Martin Jacqueline D
Bought by
Martin Marybeth M
Current Estimated Value
Home Financials for this Owner
Home Financials are based on the most recent Mortgage that was taken out on this home.
Original Mortgage
$150,000
Outstanding Balance
$120,424
Interest Rate
3.42%
Mortgage Type
Commercial
Estimated Equity
$300,493
Purchase Details
Closed on
Jul 21, 1995
Sold by
Est Brassard Myra A and Brassard Marie
Bought by
Martin Frank and Martin Jacqueline
Create a Home Valuation Report for This Property
The Home Valuation Report is an in-depth analysis detailing your home's value as well as a comparison with similar homes in the area
Home Values in the Area
Average Home Value in this Area
Purchase History
| Date | Buyer | Sale Price | Title Company |
|---|---|---|---|
| Martin Marybeth M | $87,269 | -- | |
| Martin Frank | $105,000 | -- |
Source: Public Records
Mortgage History
| Date | Status | Borrower | Loan Amount |
|---|---|---|---|
| Open | Martin Marybeth M | $150,000 | |
| Previous Owner | Martin Frank | $100,000 |
Source: Public Records
Tax History Compared to Growth
Tax History
| Year | Tax Paid | Tax Assessment Tax Assessment Total Assessment is a certain percentage of the fair market value that is determined by local assessors to be the total taxable value of land and additions on the property. | Land | Improvement |
|---|---|---|---|---|
| 2025 | $14,860 | $519,400 | $100,900 | $418,500 |
| 2024 | $13,803 | $459,500 | $100,900 | $358,600 |
| 2023 | $12,779 | $408,800 | $87,700 | $321,100 |
| 2022 | $12,762 | $382,900 | $87,700 | $295,200 |
| 2021 | $12,688 | $350,500 | $66,900 | $283,600 |
| 2020 | $12,324 | $350,500 | $66,900 | $283,600 |
| 2019 | $12,075 | $346,000 | $65,200 | $280,800 |
| 2018 | $11,754 | $345,400 | $65,200 | $280,200 |
| 2017 | $11,374 | $345,400 | $65,200 | $280,200 |
| 2016 | $11,020 | $324,300 | $63,200 | $261,100 |
| 2015 | $10,290 | $324,300 | $63,200 | $261,100 |
| 2014 | $9,998 | $324,300 | $63,200 | $261,100 |
Source: Public Records
Map
Nearby Homes
- 24 Litchfield St
- 103 Illinois St
- 52 Richards St
- 56 Richards St
- 54 Richards St
- 180 Canterbury St
- 160 Fremont St Unit 204
- 141 Cambridge St
- 28 Richards St
- 31 Camp St
- 21 Illinois St Unit 508
- 14 Douglas Ct
- 10 Douglas Ct
- 120 Grand St
- 5 Freeland Terrace
- 21 Hitchcock Rd
- 73 Southgate St
- 12 Stoneland Rd
- 4 Albert St
- 1 Cheney St
- 229 Canterbury St
- 9 Litchfield St
- 217 Canterbury St
- 11 Litchfield St
- 2 Litchfield St
- 10 Litchfield St
- 19 Litchfield St
- 12 Litchfield St
- 215 Canterbury St
- 233 Canterbury St
- 14 Litchfield St
- 200 Canterbury St
- 3 S Crystal St
- 231 Cambridge St
- 16 Litchfield St
- 223 Cambridge St
- 205 Canterbury St
- 221 Cambridge St
- 23 Litchfield St
- 239 Cambridge St