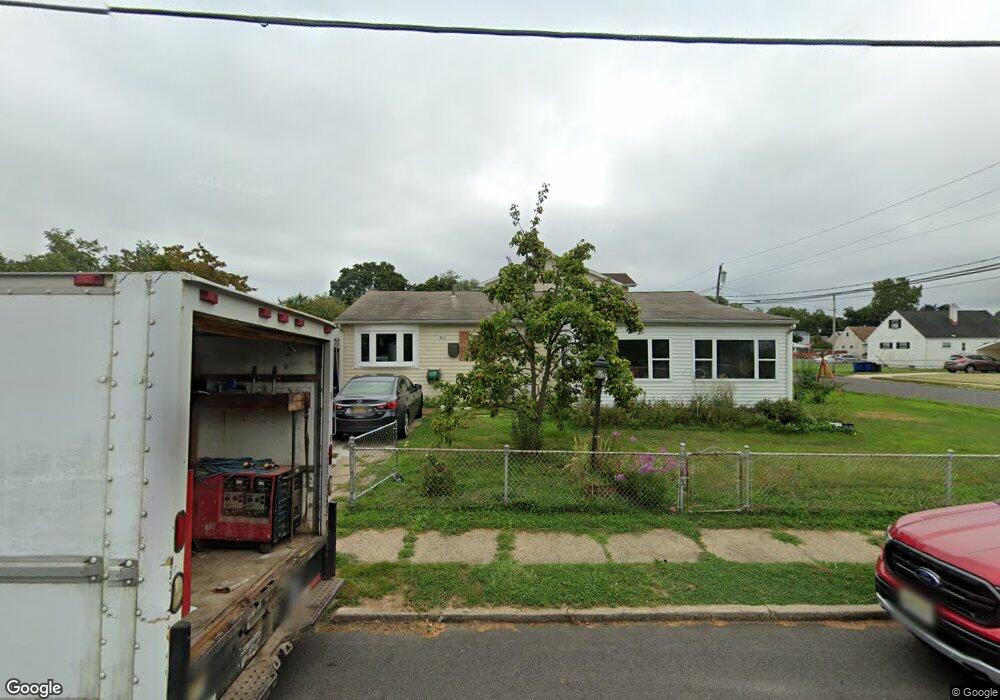
219 Cardinal Ln Mount Holly, NJ 08060
Estimated Value: $288,000 - $308,000
--
Bed
--
Bath
1,232
Sq Ft
$241/Sq Ft
Est. Value
About This Home
This home is located at 219 Cardinal Ln, Mount Holly, NJ 08060 and is currently estimated at $296,776, approximately $240 per square foot. 219 Cardinal Ln is a home located in Burlington County with nearby schools including John Brainerd Elementary School, Folwell Elementary School, and F.W. Holbein School.
Ownership History
Date
Name
Owned For
Owner Type
Purchase Details
Closed on
Dec 3, 2021
Sold by
Tran and Yen
Bought by
Joseph Joshua A and Frost Jennifer P
Current Estimated Value
Home Financials for this Owner
Home Financials are based on the most recent Mortgage that was taken out on this home.
Original Mortgage
$160,000
Outstanding Balance
$147,178
Interest Rate
3.12%
Mortgage Type
New Conventional
Estimated Equity
$149,598
Purchase Details
Closed on
Jul 27, 1988
Bought by
Tran David and Yen Dang
Create a Home Valuation Report for This Property
The Home Valuation Report is an in-depth analysis detailing your home's value as well as a comparison with similar homes in the area
Home Values in the Area
Average Home Value in this Area
Purchase History
| Date | Buyer | Sale Price | Title Company |
|---|---|---|---|
| Joseph Joshua A | $200,000 | Surety Title | |
| Joseph Joshua A | $200,000 | Surety Title | |
| Tran David | $75,000 | -- |
Source: Public Records
Mortgage History
| Date | Status | Borrower | Loan Amount |
|---|---|---|---|
| Open | Joseph Joshua A | $160,000 | |
| Closed | Joseph Joshua A | $160,000 |
Source: Public Records
Tax History Compared to Growth
Tax History
| Year | Tax Paid | Tax Assessment Tax Assessment Total Assessment is a certain percentage of the fair market value that is determined by local assessors to be the total taxable value of land and additions on the property. | Land | Improvement |
|---|---|---|---|---|
| 2025 | $6,088 | $173,400 | $47,600 | $125,800 |
| 2024 | $5,819 | $173,400 | $47,600 | $125,800 |
| 2023 | $5,819 | $173,400 | $47,600 | $125,800 |
| 2022 | $5,615 | $173,400 | $47,600 | $125,800 |
| 2021 | $5,523 | $173,400 | $47,600 | $125,800 |
| 2020 | $5,308 | $173,400 | $47,600 | $125,800 |
| 2019 | $5,188 | $173,400 | $47,600 | $125,800 |
| 2018 | $5,096 | $173,400 | $47,600 | $125,800 |
| 2017 | $4,964 | $173,400 | $47,600 | $125,800 |
| 2016 | $4,850 | $173,400 | $47,600 | $125,800 |
| 2015 | $4,748 | $173,400 | $47,600 | $125,800 |
| 2014 | $4,573 | $173,400 | $47,600 | $125,800 |
Source: Public Records
Map
Nearby Homes