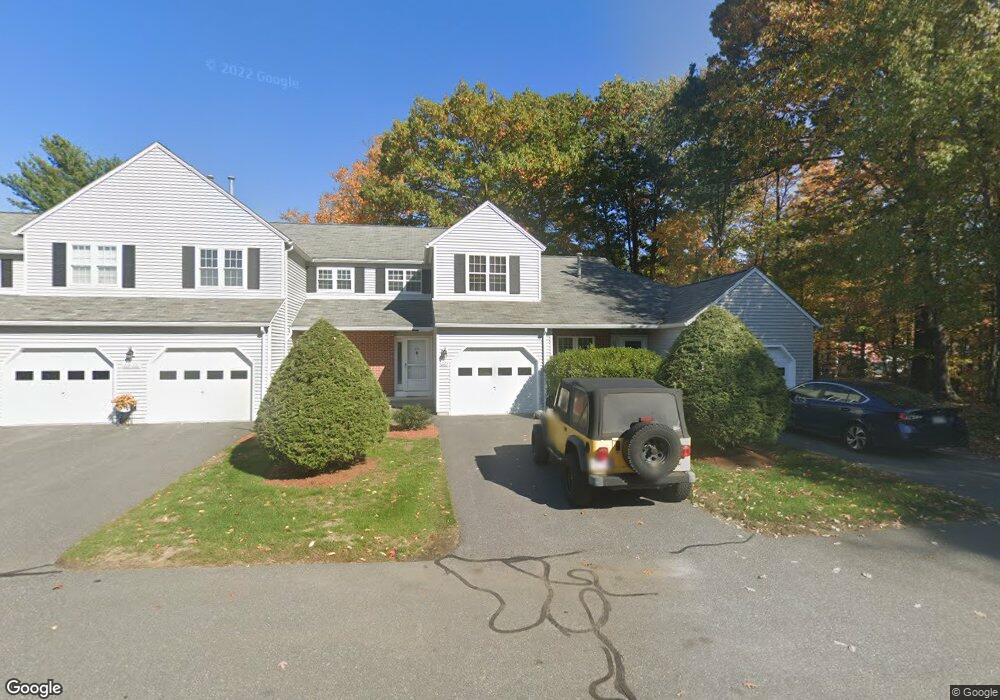
219 Chapman Place Leominster, MA 01453
Estimated Value: $370,502 - $396,000
2
Beds
3
Baths
1,268
Sq Ft
$302/Sq Ft
Est. Value
About This Home
This home is located at 219 Chapman Place, Leominster, MA 01453 and is currently estimated at $382,376, approximately $301 per square foot. 219 Chapman Place is a home located in Worcester County with nearby schools including Leominster High School, St. Anna Catholic School, and St. Leo School.
Ownership History
Date
Name
Owned For
Owner Type
Purchase Details
Closed on
Oct 12, 2022
Sold by
Robles Evelyn
Bought by
219 Chapman Place Rt
Current Estimated Value
Purchase Details
Closed on
Oct 27, 2000
Sold by
Vosburgh Barbara A
Bought by
Robles Evelyn
Home Financials for this Owner
Home Financials are based on the most recent Mortgage that was taken out on this home.
Original Mortgage
$99,920
Interest Rate
7.83%
Mortgage Type
Purchase Money Mortgage
Purchase Details
Closed on
Jan 22, 1993
Sold by
Szypko Mark A
Bought by
Vosburgh Barbara A
Home Financials for this Owner
Home Financials are based on the most recent Mortgage that was taken out on this home.
Original Mortgage
$67,400
Interest Rate
8.15%
Mortgage Type
Purchase Money Mortgage
Purchase Details
Closed on
Jan 9, 1987
Sold by
Northwoods Dev Corp
Bought by
Szyfko Mark A
Create a Home Valuation Report for This Property
The Home Valuation Report is an in-depth analysis detailing your home's value as well as a comparison with similar homes in the area
Home Values in the Area
Average Home Value in this Area
Purchase History
| Date | Buyer | Sale Price | Title Company |
|---|---|---|---|
| 219 Chapman Place Rt | -- | None Available | |
| Robles Evelyn | $124,900 | -- | |
| Vosburgh Barbara A | $70,000 | -- | |
| Szyfko Mark A | $110,900 | -- |
Source: Public Records
Mortgage History
| Date | Status | Borrower | Loan Amount |
|---|---|---|---|
| Previous Owner | Szyfko Mark A | $133,600 | |
| Previous Owner | Szyfko Mark A | $103,500 | |
| Previous Owner | Szyfko Mark A | $99,920 | |
| Previous Owner | Szyfko Mark A | $67,400 |
Source: Public Records
Tax History Compared to Growth
Tax History
| Year | Tax Paid | Tax Assessment Tax Assessment Total Assessment is a certain percentage of the fair market value that is determined by local assessors to be the total taxable value of land and additions on the property. | Land | Improvement |
|---|---|---|---|---|
| 2025 | $4,442 | $316,600 | $0 | $316,600 |
| 2024 | $3,968 | $273,500 | $0 | $273,500 |
| 2023 | $3,775 | $242,900 | $0 | $242,900 |
| 2022 | $3,653 | $220,600 | $0 | $220,600 |
| 2021 | $3,666 | $202,200 | $0 | $202,200 |
| 2020 | $3,429 | $190,700 | $0 | $190,700 |
| 2019 | $3,321 | $179,100 | $0 | $179,100 |
| 2018 | $3,244 | $167,800 | $0 | $167,800 |
| 2017 | $3,147 | $159,500 | $0 | $159,500 |
| 2016 | $2,914 | $148,800 | $0 | $148,800 |
| 2015 | $2,751 | $141,500 | $0 | $141,500 |
| 2014 | $2,741 | $145,100 | $0 | $145,100 |
Source: Public Records
Map
Nearby Homes
- 177 Chapman Place
- 93 Chapman Place Unit 93
- 197 Chapman Place Unit 197
- 30 Abbey Rd Unit 207
- 10 Abbey Rd Unit 108
- 36 Meadow Pond Dr Unit I
- 556 Central St Unit 43
- 556 Central St Unit 39
- 399 Union St
- 315 Grant St
- 498 Lancaster St
- 6 Longwood Ave
- 91 Eugene St
- 23 Lantern Ln
- 60 Howard St
- 104 Sylvan Ave
- 98 Sylvan Ave
- 59 Webber St
- 1237 Central St Unit 15
- 594 Pleasant St
- 134 Chapman Place Unit 134
- 130 Chapman Place Unit 130
- 217 Chapman Place
- 215 Chapman Place
- 211 Chapman Place
- 207 Chapman Place
- 201 Chapman Place
- 199 Chapman Place
- 193 Chapman Place
- 187 Chapman Place
- 184 Chapman Place
- 183 Chapman Place
- 181 Chapman Place
- 179 Chapman Place
- 178 Chapman Place
- 175 Chapman Place
- 171 Chapman Place
- 165 Chapman Place
- 164 Chapman Place
- 160 Chapman Place