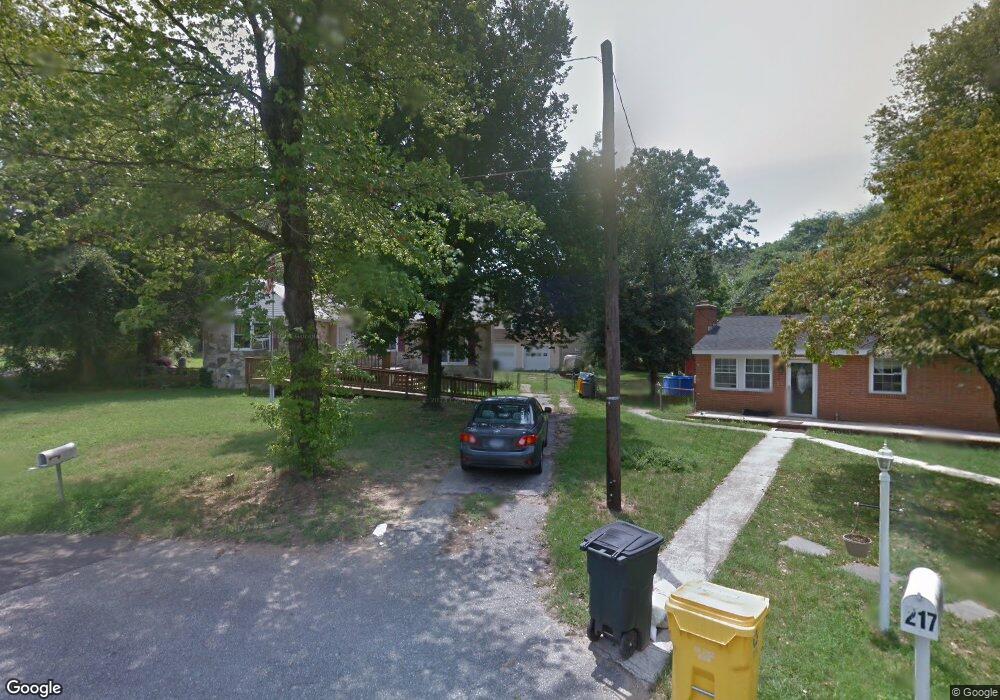
219 Ditty Ct Glen Burnie, MD 21060
Estimated Value: $372,374 - $442,000
--
Bed
2
Baths
1,160
Sq Ft
$349/Sq Ft
Est. Value
About This Home
This home is located at 219 Ditty Ct, Glen Burnie, MD 21060 and is currently estimated at $405,094, approximately $349 per square foot. 219 Ditty Ct is a home located in Anne Arundel County with nearby schools including Glendale Elementary School, Marley Middle School, and Glen Burnie High School.
Ownership History
Date
Name
Owned For
Owner Type
Purchase Details
Closed on
Jul 14, 2021
Sold by
Pieters Pierre A and Pieters Nancy E
Bought by
Pieters Pierre A and Pieters Nancy E
Current Estimated Value
Home Financials for this Owner
Home Financials are based on the most recent Mortgage that was taken out on this home.
Original Mortgage
$430,500
Outstanding Balance
$421,981
Interest Rate
2.05%
Mortgage Type
Reverse Mortgage Home Equity Conversion Mortgage
Estimated Equity
-$16,887
Purchase Details
Closed on
Mar 3, 2003
Sold by
Pieters Johannes H
Bought by
Pieters Johannes H P and Pieters Pierre A
Create a Home Valuation Report for This Property
The Home Valuation Report is an in-depth analysis detailing your home's value as well as a comparison with similar homes in the area
Home Values in the Area
Average Home Value in this Area
Purchase History
| Date | Buyer | Sale Price | Title Company |
|---|---|---|---|
| Pieters Pierre A | -- | Accommodation | |
| Pieters Johannes H P | -- | -- |
Source: Public Records
Mortgage History
| Date | Status | Borrower | Loan Amount |
|---|---|---|---|
| Open | Pieters Pierre A | $430,500 |
Source: Public Records
Tax History Compared to Growth
Tax History
| Year | Tax Paid | Tax Assessment Tax Assessment Total Assessment is a certain percentage of the fair market value that is determined by local assessors to be the total taxable value of land and additions on the property. | Land | Improvement |
|---|---|---|---|---|
| 2025 | $2,805 | $347,100 | $159,600 | $187,500 |
| 2024 | $2,805 | $327,467 | $0 | $0 |
| 2023 | $2,696 | $307,833 | $0 | $0 |
| 2022 | $2,491 | $288,200 | $134,600 | $153,600 |
| 2021 | $2,332 | $278,833 | $0 | $0 |
| 2020 | $2,332 | $269,467 | $0 | $0 |
| 2019 | $4,519 | $260,100 | $106,200 | $153,900 |
| 2018 | $2,586 | $255,000 | $0 | $0 |
| 2017 | $2,172 | $249,900 | $0 | $0 |
| 2016 | -- | $244,800 | $0 | $0 |
| 2015 | -- | $244,800 | $0 | $0 |
| 2014 | -- | $244,800 | $0 | $0 |
Source: Public Records
Map
Nearby Homes