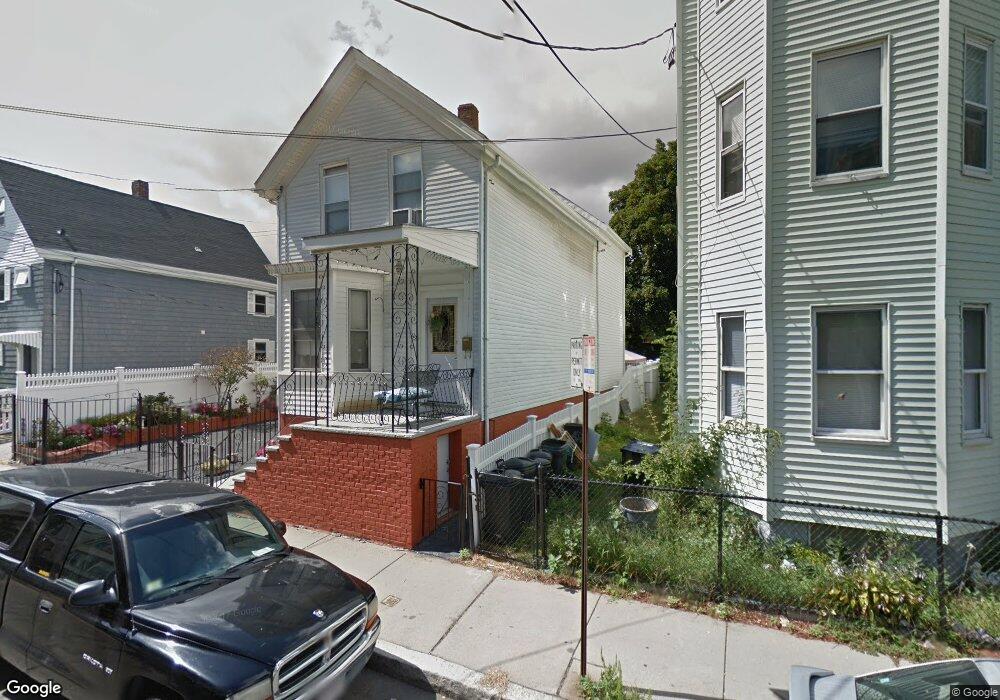
219 Elm St Unit 221 Cambridge, MA 02139
Wellington-Harrington NeighborhoodEstimated Value: $1,272,047 - $2,614,000
6
Beds
3
Baths
2,592
Sq Ft
$689/Sq Ft
Est. Value
About This Home
This home is located at 219 Elm St Unit 221, Cambridge, MA 02139 and is currently estimated at $1,785,512, approximately $688 per square foot. 219 Elm St Unit 221 is a home located in Middlesex County with nearby schools including Prospect Hill Academy Charter School and Community Charter School of Cambridge.
Ownership History
Date
Name
Owned For
Owner Type
Purchase Details
Closed on
Aug 1, 2011
Sold by
Prevlin Agnes
Bought by
219-221 Elm Street Llc
Current Estimated Value
Home Financials for this Owner
Home Financials are based on the most recent Mortgage that was taken out on this home.
Original Mortgage
$378,000
Interest Rate
4.52%
Mortgage Type
Purchase Money Mortgage
Purchase Details
Closed on
Aug 19, 1994
Sold by
School St Dev
Bought by
Petropoulos John G and Spadone Lynn A
Home Financials for this Owner
Home Financials are based on the most recent Mortgage that was taken out on this home.
Original Mortgage
$203,150
Interest Rate
8.61%
Mortgage Type
Purchase Money Mortgage
Create a Home Valuation Report for This Property
The Home Valuation Report is an in-depth analysis detailing your home's value as well as a comparison with similar homes in the area
Home Values in the Area
Average Home Value in this Area
Purchase History
| Date | Buyer | Sale Price | Title Company |
|---|---|---|---|
| 219-221 Elm Street Llc | $540,000 | -- | |
| Petropoulos John G | $268,020 | -- | |
| Petropoulos John G | $268,020 | -- |
Source: Public Records
Mortgage History
| Date | Status | Borrower | Loan Amount |
|---|---|---|---|
| Open | Petropoulos John G | $550,000 | |
| Closed | 219-221 Elm Street Llc | $378,000 | |
| Previous Owner | Petropoulos John G | $203,150 | |
| Previous Owner | Petropoulos John G | $154,000 |
Source: Public Records
Tax History Compared to Growth
Tax History
| Year | Tax Paid | Tax Assessment Tax Assessment Total Assessment is a certain percentage of the fair market value that is determined by local assessors to be the total taxable value of land and additions on the property. | Land | Improvement |
|---|---|---|---|---|
| 2025 | $8,430 | $1,327,500 | $818,700 | $508,800 |
| 2024 | $7,961 | $1,344,800 | $854,700 | $490,100 |
| 2023 | $7,680 | $1,310,500 | $869,000 | $441,500 |
| 2022 | $7,327 | $1,237,700 | $838,700 | $399,000 |
| 2021 | $7,058 | $1,206,500 | $822,500 | $384,000 |
| 2020 | $6,809 | $1,184,100 | $821,300 | $362,800 |
| 2019 | $6,261 | $1,054,000 | $720,800 | $333,200 |
| 2018 | $5,746 | $913,500 | $620,400 | $293,100 |
| 2017 | $5,501 | $847,600 | $554,500 | $293,100 |
| 2016 | $5,136 | $734,700 | $464,300 | $270,400 |
| 2015 | $4,877 | $623,700 | $388,100 | $235,600 |
| 2014 | $4,425 | $528,000 | $311,900 | $216,100 |
Source: Public Records
Map
Nearby Homes
- 43 Lincoln St
- 244 Norfolk St Unit 244
- 30 Union St Unit 1
- 392 Norfolk St Unit 1
- 114 Elm St
- 31 Tremont St
- 350 Windsor St Unit 1
- 350 Windsor St Unit 2
- 350 Windsor St
- 13 Palermo St
- 305 Webster Ave Unit 101
- 142 Amory St Unit Front
- 432 Norfolk St Unit 3J
- 432 Norfolk St Unit 4G
- 51 Market St Unit 2
- 411 Norfolk St Unit 1F
- 94 Hampshire St Unit B
- 222 Columbia St Unit 2
- 429 Norfolk St Unit 1
- 196 Prospect St
- 221 Elm St Unit 1
- 221 Elm St Unit 2
- 221 Elm St Unit 3
- 221 Elm St
- 219 Elm St Unit 3
- 225 Elm St
- 217 Elm St
- 229 Elm St
- 229 Elm St Unit 1
- 229 Elm St Unit 2
- 229 Elm St Unit 3
- 211 Elm St
- 209 Elm St
- 336 Norfolk St
- 235 Elm St Unit 1
- 338 Norfolk St Unit 2
- 338 Norfolk St Unit 1
- 205 Elm St
- 205 Elm St Unit 2
- 203 Elm St Unit 3