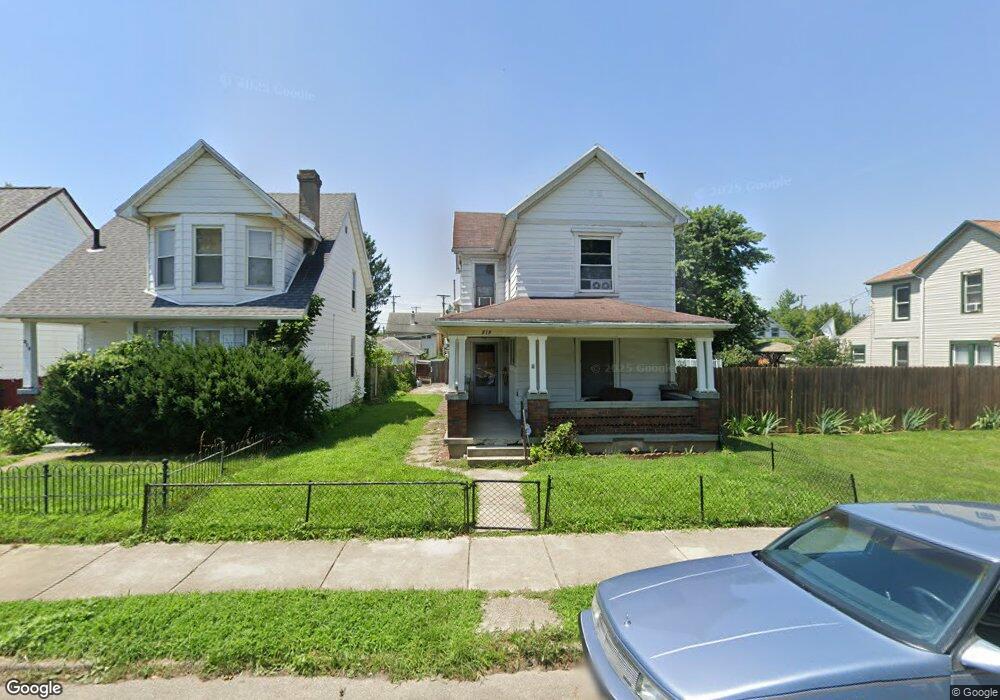
219 Grove Ave Dayton, OH 45404
Old North Dayton NeighborhoodEstimated Value: $64,000 - $136,000
4
Beds
1
Bath
1,530
Sq Ft
$65/Sq Ft
Est. Value
About This Home
This home is located at 219 Grove Ave, Dayton, OH 45404 and is currently estimated at $99,851, approximately $65 per square foot. 219 Grove Ave is a home located in Montgomery County with nearby schools including Kiser Elementary, Ruskin Elementary School, and Liberty High School.
Ownership History
Date
Name
Owned For
Owner Type
Purchase Details
Closed on
Jun 8, 2005
Sold by
Martin Robert J
Bought by
Alamodin Virgilia and Naguit Eduardo
Current Estimated Value
Home Financials for this Owner
Home Financials are based on the most recent Mortgage that was taken out on this home.
Original Mortgage
$47,750
Outstanding Balance
$25,105
Interest Rate
5.87%
Mortgage Type
FHA
Estimated Equity
$74,746
Purchase Details
Closed on
Oct 19, 2004
Sold by
Estate Of Anna Martin
Bought by
Martin Robert J
Create a Home Valuation Report for This Property
The Home Valuation Report is an in-depth analysis detailing your home's value as well as a comparison with similar homes in the area
Home Values in the Area
Average Home Value in this Area
Purchase History
| Date | Buyer | Sale Price | Title Company |
|---|---|---|---|
| Alamodin Virgilia | $48,500 | -- | |
| Martin Robert J | -- | None Available |
Source: Public Records
Mortgage History
| Date | Status | Borrower | Loan Amount |
|---|---|---|---|
| Open | Alamodin Virgilia | $47,750 |
Source: Public Records
Tax History Compared to Growth
Tax History
| Year | Tax Paid | Tax Assessment Tax Assessment Total Assessment is a certain percentage of the fair market value that is determined by local assessors to be the total taxable value of land and additions on the property. | Land | Improvement |
|---|---|---|---|---|
| 2024 | $940 | $15,080 | $2,520 | $12,560 |
| 2023 | $940 | $15,080 | $2,520 | $12,560 |
| 2022 | $1,026 | $12,860 | $2,160 | $10,700 |
| 2021 | $1,021 | $12,860 | $2,160 | $10,700 |
| 2020 | $1,020 | $12,860 | $2,160 | $10,700 |
| 2019 | $730 | $7,830 | $1,810 | $6,020 |
| 2018 | $731 | $7,830 | $1,810 | $6,020 |
| 2017 | $726 | $7,830 | $1,810 | $6,020 |
| 2016 | $717 | $7,330 | $1,730 | $5,600 |
| 2015 | $684 | $7,330 | $1,730 | $5,600 |
| 2014 | $684 | $7,330 | $1,730 | $5,600 |
| 2012 | -- | $13,570 | $3,960 | $9,610 |
Source: Public Records
Map
Nearby Homes