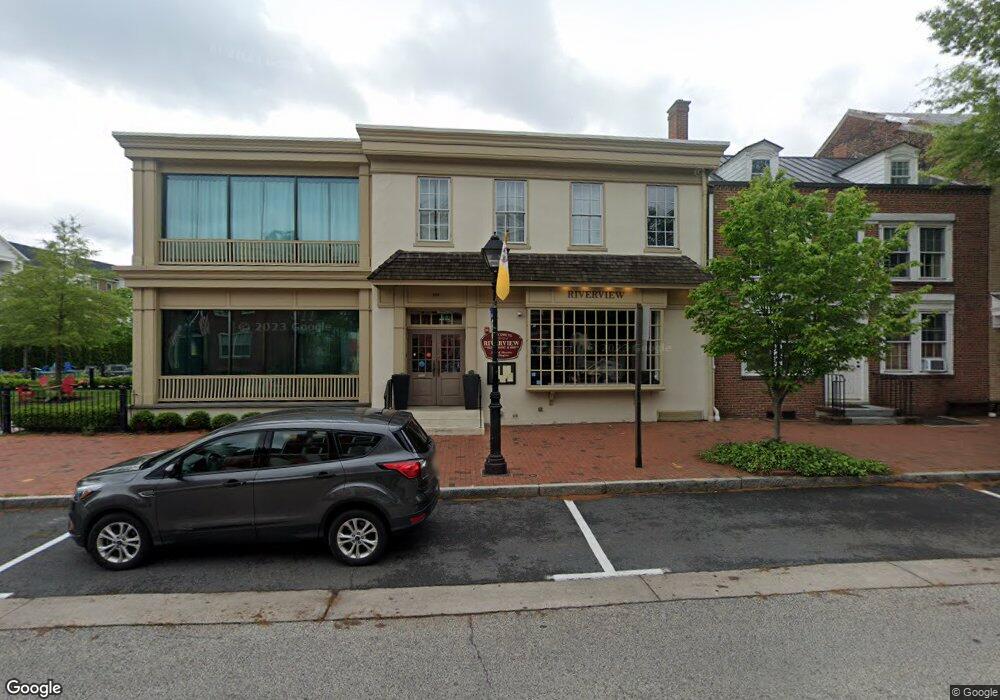
219 High St Burlington, NJ 08016
Studio
--
Bath
10,332
Sq Ft
21,780
Sq Ft Lot
About This Home
This home is located at 219 High St, Burlington, NJ 08016. 219 High St is a home located in Burlington County with nearby schools including Burlington City High School, Doane Academy, and St Paul's Parochial School.
Ownership History
Date
Name
Owned For
Owner Type
Purchase Details
Closed on
Mar 5, 2025
Sold by
Burlington Trading Llc
Bought by
219 High Street Llc
Home Financials for this Owner
Home Financials are based on the most recent Mortgage that was taken out on this home.
Original Mortgage
$550,000
Outstanding Balance
$545,327
Interest Rate
6.95%
Mortgage Type
New Conventional
Purchase Details
Closed on
Aug 21, 2014
Sold by
Fisher and Fisher James E
Bought by
Burlington Trading Llc
Create a Home Valuation Report for This Property
The Home Valuation Report is an in-depth analysis detailing your home's value as well as a comparison with similar homes in the area
Home Values in the Area
Average Home Value in this Area
Purchase History
| Date | Buyer | Sale Price | Title Company |
|---|---|---|---|
| 219 High Street Llc | $800,000 | None Listed On Document | |
| 219 High Street Llc | $800,000 | None Listed On Document | |
| Burlington Trading Llc | $600,000 | First American Title Ins Co |
Source: Public Records
Mortgage History
| Date | Status | Borrower | Loan Amount |
|---|---|---|---|
| Open | 219 High Street Llc | $550,000 | |
| Closed | 219 High Street Llc | $550,000 |
Source: Public Records
Tax History
| Year | Tax Paid | Tax Assessment Tax Assessment Total Assessment is a certain percentage of the fair market value that is determined by local assessors to be the total taxable value of land and additions on the property. | Land | Improvement |
|---|---|---|---|---|
| 2025 | $51,960 | $1,200,000 | $199,000 | $1,001,000 |
| 2024 | $51,048 | $1,200,000 | $199,000 | $1,001,000 |
| 2023 | $51,048 | $1,200,000 | $199,000 | $1,001,000 |
| 2022 | $50,484 | $1,200,000 | $199,000 | $1,001,000 |
| 2021 | $49,752 | $1,200,000 | $199,000 | $1,001,000 |
| 2020 | $47,976 | $1,200,000 | $199,000 | $1,001,000 |
| 2019 | $45,756 | $1,200,000 | $199,000 | $1,001,000 |
| 2018 | $44,976 | $1,200,000 | $199,000 | $1,001,000 |
| 2017 | $25,431 | $700,000 | $199,000 | $501,000 |
| 2016 | $24,472 | $700,000 | $199,000 | $501,000 |
| 2015 | $28,215 | $837,000 | $199,000 | $638,000 |
| 2014 | $27,286 | $837,000 | $199,000 | $638,000 |
Source: Public Records
Map
Nearby Homes
Your Personal Tour Guide
Ask me questions while you tour the home.