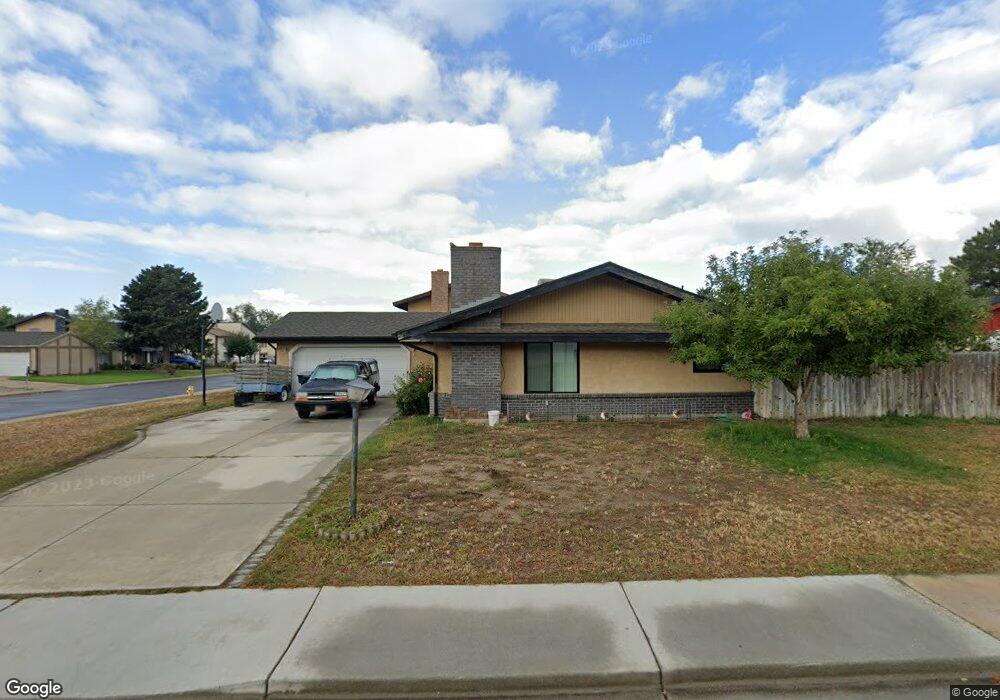
219 N 300 W Orem, UT 84057
Suncrest NeighborhoodEstimated Value: $427,000 - $464,000
3
Beds
2
Baths
1,282
Sq Ft
$345/Sq Ft
Est. Value
About This Home
This home is located at 219 N 300 W, Orem, UT 84057 and is currently estimated at $442,366, approximately $345 per square foot. 219 N 300 W is a home located in Utah County with nearby schools including Orem Junior High School, Mountain View High School, and Noah Webster Academy.
Ownership History
Date
Name
Owned For
Owner Type
Purchase Details
Closed on
Feb 22, 2006
Sold by
Hallam Randy C and Hallam Leah A
Bought by
Hallam Amy C
Current Estimated Value
Home Financials for this Owner
Home Financials are based on the most recent Mortgage that was taken out on this home.
Original Mortgage
$157,102
Outstanding Balance
$83,123
Interest Rate
5.2%
Mortgage Type
FHA
Estimated Equity
$359,243
Purchase Details
Closed on
Feb 17, 1998
Sold by
Kearl Bradley M
Bought by
Hallam Randy C and Hallam Leah A
Home Financials for this Owner
Home Financials are based on the most recent Mortgage that was taken out on this home.
Original Mortgage
$120,246
Interest Rate
6.97%
Mortgage Type
FHA
Purchase Details
Closed on
Feb 6, 1997
Sold by
Kearl Magali G
Bought by
Kearl Bradley Mark
Create a Home Valuation Report for This Property
The Home Valuation Report is an in-depth analysis detailing your home's value as well as a comparison with similar homes in the area
Home Values in the Area
Average Home Value in this Area
Purchase History
| Date | Buyer | Sale Price | Title Company |
|---|---|---|---|
| Hallam Amy C | -- | Mountain West Title Company | |
| Hallam Randy C | -- | -- | |
| Kearl Bradley M | -- | -- | |
| Kearl Bradley Mark | -- | -- |
Source: Public Records
Mortgage History
| Date | Status | Borrower | Loan Amount |
|---|---|---|---|
| Open | Hallam Amy C | $157,102 | |
| Previous Owner | Hallam Randy C | $120,246 |
Source: Public Records
Tax History
| Year | Tax Paid | Tax Assessment Tax Assessment Total Assessment is a certain percentage of the fair market value that is determined by local assessors to be the total taxable value of land and additions on the property. | Land | Improvement |
|---|---|---|---|---|
| 2025 | $1,629 | $213,840 | -- | -- |
| 2024 | $1,629 | $199,210 | $0 | $0 |
| 2023 | $1,489 | $195,635 | $0 | $0 |
| 2022 | $1,587 | $202,125 | $0 | $0 |
| 2021 | $1,437 | $277,100 | $110,000 | $167,100 |
| 2020 | $1,320 | $250,200 | $88,000 | $162,200 |
| 2019 | $1,162 | $229,000 | $88,000 | $141,000 |
| 2018 | $1,100 | $207,200 | $84,600 | $122,600 |
| 2017 | $1,025 | $103,400 | $0 | $0 |
| 2016 | $1,005 | $93,500 | $0 | $0 |
| 2015 | $1,029 | $90,530 | $0 | $0 |
| 2014 | $987 | $86,405 | $0 | $0 |
Source: Public Records
Map
Nearby Homes
Your Personal Tour Guide
Ask me questions while you tour the home.