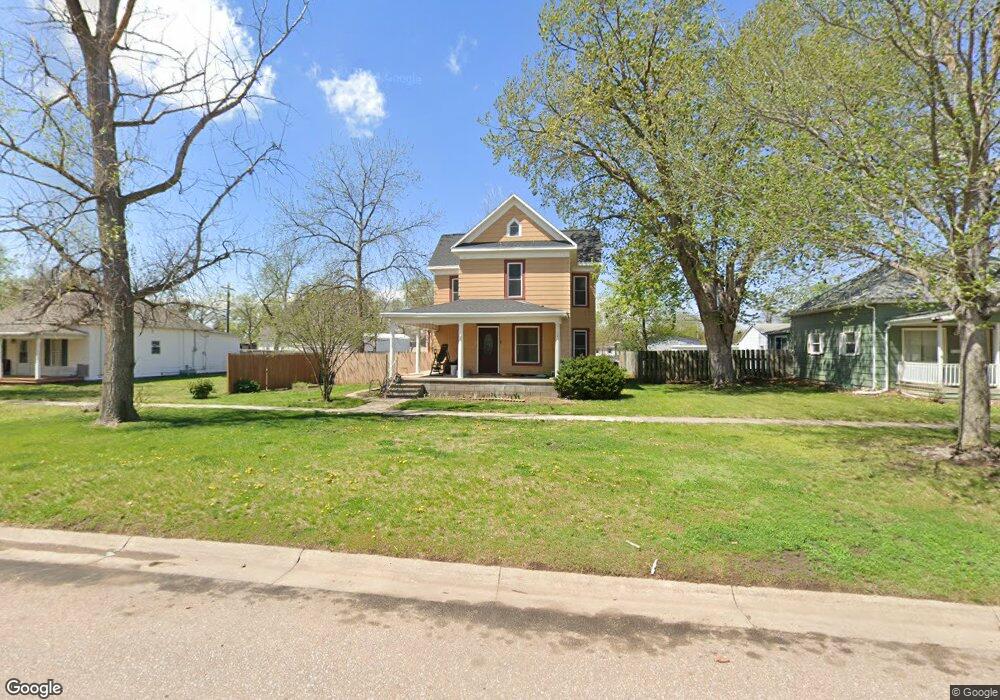
219 N Alexander Ave Clay Center, NE 68933
Estimated Value: $102,000 - $167,000
3
Beds
1
Bath
1,880
Sq Ft
$67/Sq Ft
Est. Value
About This Home
This home is located at 219 N Alexander Ave, Clay Center, NE 68933 and is currently estimated at $125,889, approximately $66 per square foot. 219 N Alexander Ave is a home located in Clay County with nearby schools including Clay Center Elementary School.
Ownership History
Date
Name
Owned For
Owner Type
Purchase Details
Closed on
Jul 25, 2023
Sold by
Eastin Laurie A
Bought by
Amos Joshua and Amos Carysa
Current Estimated Value
Purchase Details
Closed on
Apr 1, 2022
Sold by
Eastin Laurie A
Bought by
Amos Joshua and Amos Carysa
Purchase Details
Closed on
Jun 11, 2014
Sold by
Fannie Mae
Bought by
Eastin Laurie A
Create a Home Valuation Report for This Property
The Home Valuation Report is an in-depth analysis detailing your home's value as well as a comparison with similar homes in the area
Home Values in the Area
Average Home Value in this Area
Purchase History
| Date | Buyer | Sale Price | Title Company |
|---|---|---|---|
| Amos Joshua | $40,000 | None Listed On Document | |
| Amos Joshua | $40,000 | -- | |
| Eastin Laurie A | -- | Dri Title |
Source: Public Records
Tax History Compared to Growth
Tax History
| Year | Tax Paid | Tax Assessment Tax Assessment Total Assessment is a certain percentage of the fair market value that is determined by local assessors to be the total taxable value of land and additions on the property. | Land | Improvement |
|---|---|---|---|---|
| 2024 | $1,183 | $93,655 | $5,345 | $88,310 |
| 2023 | $1,451 | $90,375 | $4,750 | $85,625 |
| 2022 | $1,258 | $67,885 | $2,020 | $65,865 |
| 2021 | $1,216 | $64,155 | $2,020 | $62,135 |
| 2020 | $1,186 | $61,880 | $2,020 | $59,860 |
| 2019 | $1,031 | $57,445 | $2,020 | $55,425 |
| 2018 | $1,031 | $57,445 | $2,020 | $55,425 |
| 2017 | $951 | $56,240 | $2,020 | $54,220 |
| 2016 | $1,029 | $56,240 | $2,020 | $54,220 |
| 2015 | $1,092 | $56,240 | $2,020 | $54,220 |
| 2014 | $136 | $56,240 | $2,020 | $54,220 |
| 2013 | $136 | $45,470 | $1,510 | $43,960 |
Source: Public Records
Map
Nearby Homes
- 108 W Glenvil St
- 510 N Clay Ave
- 120 Northridge Dr
- 510 W Willow St
- 416 W South St
- 0 Pheasant View Lots
- 31020 Road L County Rd
- 208 N Kearney Ave
- 405 E Maple Ave
- 401 N Adams Ave
- 408 N Harvard Ave
- 1580
- 1580 Road 320
- 401 Chestnut St
- 608 1st St
- 803 6th St
- 508 4th St
- 401 N A St
- 811 Grandview St
- 30151 Hwy 14 Fairfield Rd
- 221 N Alexander Ave
- 213 N Alexander Ave
- 201 N Alexander Ave
- 212 N Martin Ave
- 208 N Martin Ave
- 220 N Alexander Ave
- 208 N Alexander Ave
- 220 W Sutton St
- 202 N Alexander Ave
- 120 W Glenvil St
- 308 N Alexander Ave
- 121 N Alexander Ave
- 221 N Brown Ave
- 205 N Brown Ave
- 215 W Sutton St
- 215 N Martin Ave
- 203 N Martin Ave
- 219 N Martin Ave
- 209 N Martin Ave
- 120 N Martin Ave