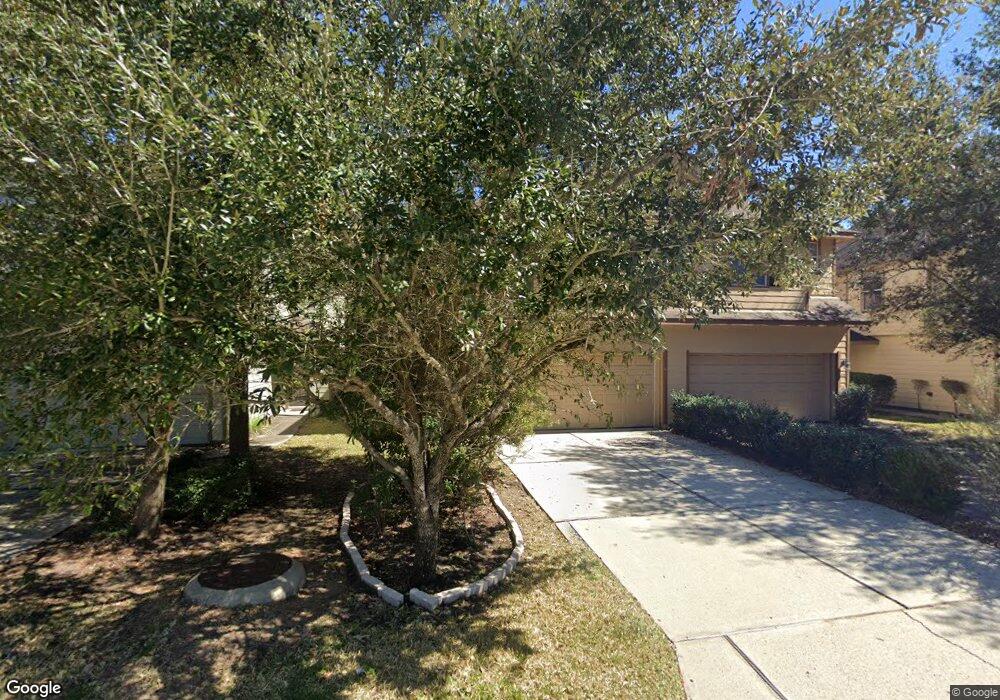
219 N Burberry Park Cir Spring, TX 77382
Sterling Ridge NeighborhoodEstimated Value: $297,711 - $337,000
3
Beds
3
Baths
1,624
Sq Ft
$194/Sq Ft
Est. Value
About This Home
This home is located at 219 N Burberry Park Cir, Spring, TX 77382 and is currently estimated at $315,178, approximately $194 per square foot. 219 N Burberry Park Cir is a home located in Montgomery County with nearby schools including Deretchin Elementary School, McCullough Junior High School, and The Woodlands High School.
Ownership History
Date
Name
Owned For
Owner Type
Purchase Details
Closed on
Mar 3, 2017
Sold by
Rodriguez Martinez Ramon
Bought by
Voggenauer Graf Adrianne
Current Estimated Value
Home Financials for this Owner
Home Financials are based on the most recent Mortgage that was taken out on this home.
Original Mortgage
$102,650
Interest Rate
3.96%
Mortgage Type
New Conventional
Purchase Details
Closed on
May 11, 2012
Sold by
Mendez Juan Yanez
Bought by
Rodriguez-Martinez Ramon
Purchase Details
Closed on
Oct 25, 2007
Sold by
Lennar Homes Of Texas
Bought by
Yanez Mendez Juan L
Home Financials for this Owner
Home Financials are based on the most recent Mortgage that was taken out on this home.
Original Mortgage
$146,157
Interest Rate
6.32%
Mortgage Type
Purchase Money Mortgage
Create a Home Valuation Report for This Property
The Home Valuation Report is an in-depth analysis detailing your home's value as well as a comparison with similar homes in the area
Home Values in the Area
Average Home Value in this Area
Purchase History
| Date | Buyer | Sale Price | Title Company |
|---|---|---|---|
| Voggenauer Graf Adrianne | -- | None Available | |
| Rodriguez-Martinez Ramon | -- | -- | |
| Yanez Mendez Juan L | -- | North American Title Co | |
| Lennar Homes Of Texas Sales & Mktg Ltd | -- | North American Title Co |
Source: Public Records
Mortgage History
| Date | Status | Borrower | Loan Amount |
|---|---|---|---|
| Previous Owner | Voggenauer Graf Adrianne | $102,650 | |
| Previous Owner | Yanez Mendez Juan L | $146,157 |
Source: Public Records
Tax History Compared to Growth
Tax History
| Year | Tax Paid | Tax Assessment Tax Assessment Total Assessment is a certain percentage of the fair market value that is determined by local assessors to be the total taxable value of land and additions on the property. | Land | Improvement |
|---|---|---|---|---|
| 2025 | $2,994 | $254,753 | -- | -- |
| 2024 | $2,644 | $231,594 | -- | -- |
| 2023 | $2,644 | $210,540 | $40,000 | $230,000 |
| 2022 | $3,868 | $191,400 | $40,000 | $0 |
| 2021 | $3,796 | $174,000 | $33,200 | $140,800 |
| 2020 | $3,918 | $171,980 | $33,200 | $138,780 |
| 2019 | $3,905 | $165,890 | $33,200 | $132,690 |
| 2018 | $3,359 | $167,000 | $33,200 | $133,800 |
| 2017 | $3,980 | $167,000 | $33,200 | $133,800 |
| 2016 | $3,861 | $162,000 | $33,200 | $128,800 |
| 2015 | $3,314 | $162,930 | $33,200 | $129,730 |
| 2014 | $3,314 | $138,940 | $33,200 | $105,740 |
Source: Public Records
Map
Nearby Homes
- 119 Benedict Canyon Loop
- 86 Oriel Oaks Cir
- 7 Stickley Ct
- 34 Gilmore Grove Place
- 22 Bryce Branch Cir
- 35 N Star Ridge Cir
- 137 E Montfair Blvd
- 133 E Montfair Blvd
- 158 S Star Ridge Cir
- 166 Hawkhurst Cir
- 163 N Hawkhurst Cir
- 146 S Star Ridge Cir
- 15 Fillgrove Place
- 78 S Bardsbrook Cir
- 115 Black Swan Place
- 51 N Scribewood Cir
- 2 Craven Park Ct
- 30 N Scribewood Cir
- 30 Whetstone Ridge Way
- 30 Black Swan Ct
- 223 N Burberry Park Cir
- 215 N Burberry Park Cir
- 227 N Burberry Park Cir
- 211 N Burberry Park Cir
- 231 N Burberry Park Cir
- 207 N Burberry Park Cir
- 3 Wickerdale Place
- 235 N Burberry Park Cir
- 203 N Burberry Park Cir
- 239 N Burberry Park Cir
- 7 Wickerdale Place
- 199 N Burberry Park Cir
- 2 S Burberry Park Cir
- 206 N Burberry Park Cir
- 11 Wickerdale Place
- 195 N Burberry Park Cir
- 198 N Burberry Park Cir
- 6 S Burberry Park Cir
- 15 Wickerdale Place
- 190 N Burberry Park Cir