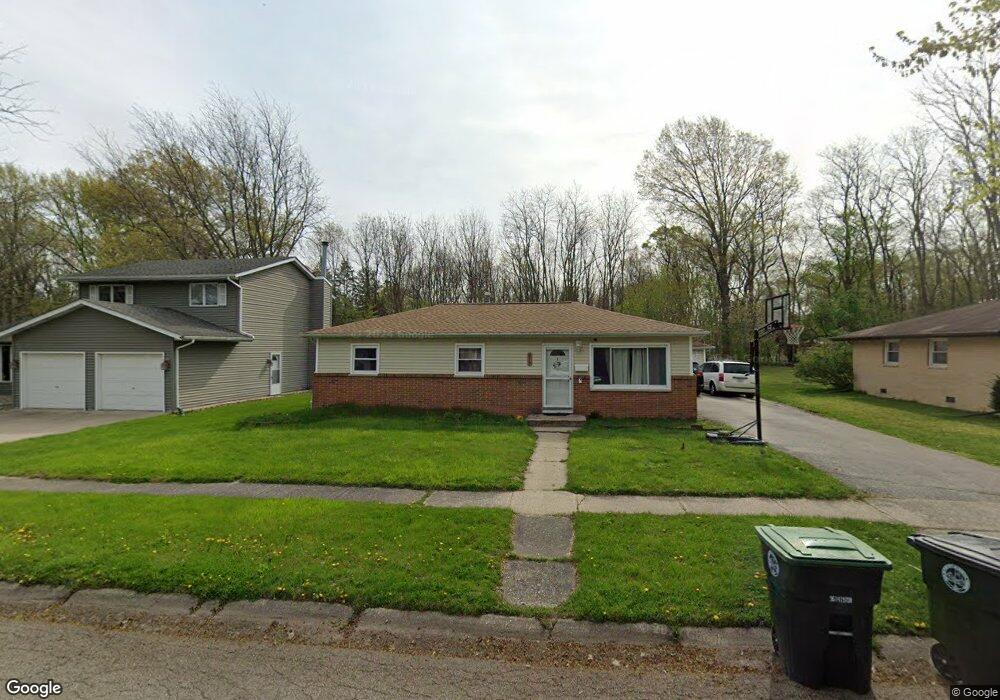
219 N Linda St Hobart, IN 46342
Estimated Value: $193,000 - $220,000
3
Beds
1
Bath
1,008
Sq Ft
$202/Sq Ft
Est. Value
About This Home
This home is located at 219 N Linda St, Hobart, IN 46342 and is currently estimated at $203,358, approximately $201 per square foot. 219 N Linda St is a home located in Lake County with nearby schools including Hobart High School, Hobart Baptist School, and Trinity Lutheran School.
Ownership History
Date
Name
Owned For
Owner Type
Purchase Details
Closed on
Mar 23, 2015
Sold by
Guess Paul
Bought by
Guess Paul and Guess Amy
Current Estimated Value
Home Financials for this Owner
Home Financials are based on the most recent Mortgage that was taken out on this home.
Original Mortgage
$110,800
Outstanding Balance
$86,611
Interest Rate
4.25%
Mortgage Type
FHA
Estimated Equity
$116,747
Purchase Details
Closed on
Oct 24, 2006
Sold by
Taylor Rose A and Taylor Michael W
Bought by
Guess Paul
Home Financials for this Owner
Home Financials are based on the most recent Mortgage that was taken out on this home.
Original Mortgage
$115,000
Interest Rate
6.23%
Mortgage Type
Purchase Money Mortgage
Purchase Details
Closed on
Aug 15, 2005
Sold by
Givens Wendy J
Bought by
Taylor Michael W and Taylor Rose A
Home Financials for this Owner
Home Financials are based on the most recent Mortgage that was taken out on this home.
Original Mortgage
$74,320
Interest Rate
5.8%
Mortgage Type
Fannie Mae Freddie Mac
Create a Home Valuation Report for This Property
The Home Valuation Report is an in-depth analysis detailing your home's value as well as a comparison with similar homes in the area
Home Values in the Area
Average Home Value in this Area
Purchase History
| Date | Buyer | Sale Price | Title Company |
|---|---|---|---|
| Guess Paul | -- | Indiana Title Network Co | |
| Guess Paul | -- | Metropolitan Title In Llc | |
| Taylor Michael W | -- | -- |
Source: Public Records
Mortgage History
| Date | Status | Borrower | Loan Amount |
|---|---|---|---|
| Open | Guess Paul | $110,800 | |
| Previous Owner | Guess Paul | $115,000 | |
| Previous Owner | Taylor Michael W | $74,320 |
Source: Public Records
Tax History Compared to Growth
Tax History
| Year | Tax Paid | Tax Assessment Tax Assessment Total Assessment is a certain percentage of the fair market value that is determined by local assessors to be the total taxable value of land and additions on the property. | Land | Improvement |
|---|---|---|---|---|
| 2024 | $5,629 | $137,500 | $23,200 | $114,300 |
| 2023 | $1,576 | $137,900 | $23,200 | $114,700 |
| 2022 | $1,576 | $135,500 | $23,200 | $112,300 |
| 2021 | $1,425 | $122,600 | $21,100 | $101,500 |
| 2020 | $1,457 | $124,900 | $21,100 | $103,800 |
| 2019 | $1,564 | $117,300 | $21,100 | $96,200 |
| 2018 | $1,362 | $106,600 | $21,100 | $85,500 |
| 2017 | $1,429 | $109,400 | $21,100 | $88,300 |
| 2016 | $1,325 | $108,200 | $21,100 | $87,100 |
| 2014 | $1,134 | $105,600 | $21,000 | $84,600 |
| 2013 | $1,090 | $103,300 | $21,100 | $82,200 |
Source: Public Records
Map
Nearby Homes
- 312 N Kelly St
- 916 E Home Ave
- 36 N Linda St
- 54 N Michigan Ave
- 249 N Liberty St
- 110 S Joliet St
- 1321 Jackson St
- 220 N Lake Park Ave
- 2 W Old Ridge Rd
- 240 Rush Ct
- 127 Cressmoor Blvd
- 416 S Liberty Place
- 121 Cressmoor Blvd
- 400 S Liberty St
- 429 S Joliet St
- 115 Cressmoor Blvd
- 1891 Cooke St
- 132 Cressmoor Blvd
- 138 Cressmoor Blvd
- 152 Cressmoor Blvd
- 225 N Linda St
- 215 N Linda St
- 211 N Linda St
- 231 N Linda St
- 232 N Linda St
- 216 N Linda St
- 201 N Linda St
- 238 N Linda St
- 243 N Linda St
- 244 N Linda St
- 208 N Linda St
- 250 N Linda St
- 247 N Linda St
- 217 N Michigan Ave
- 155 N Linda St
- 256 N Linda St
- 233 N Michigan Ave
- 154 N Linda St
- 227 N Michigan Ave
- 247 N Michigan Ave