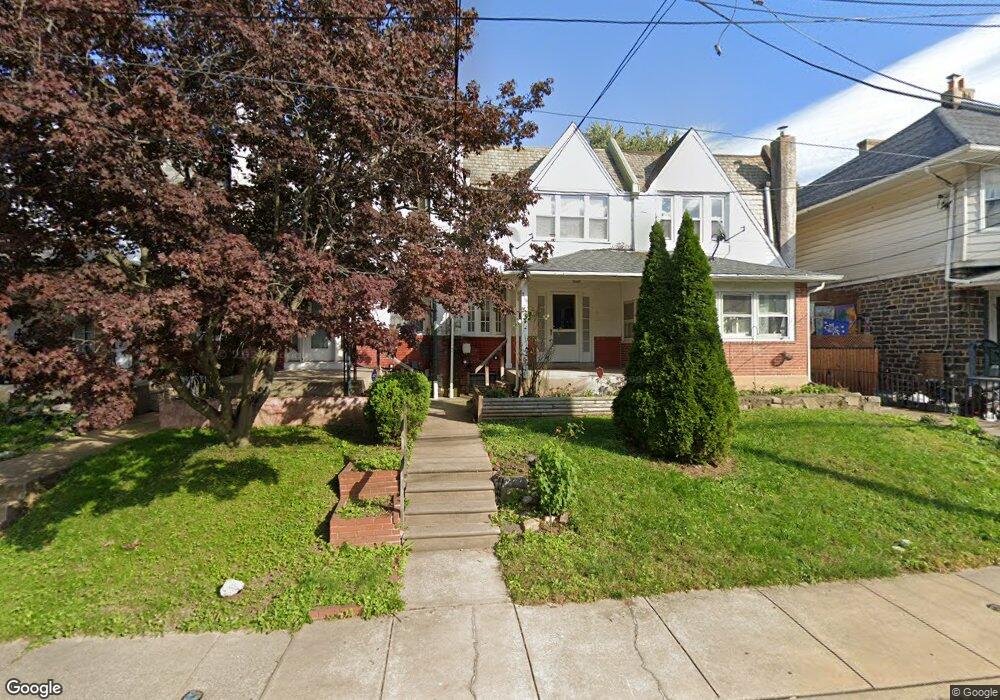
219 N Maple Ave Lansdowne, PA 19050
Estimated Value: $188,507 - $223,000
3
Beds
1
Bath
1,150
Sq Ft
$174/Sq Ft
Est. Value
About This Home
This home is located at 219 N Maple Ave, Lansdowne, PA 19050 and is currently estimated at $199,627, approximately $173 per square foot. 219 N Maple Ave is a home located in Delaware County with nearby schools including East Lansdowne Elementary School, Penn Wood Middle School, and Penn Wood High School - Cypress Street Campus.
Ownership History
Date
Name
Owned For
Owner Type
Purchase Details
Closed on
Sep 24, 2008
Sold by
Hammond Julia B
Bought by
Steele Glenn and Steele Linda
Current Estimated Value
Purchase Details
Closed on
Feb 28, 2003
Sold by
Simpkins Mackey Jean
Bought by
Hammond Julia B
Home Financials for this Owner
Home Financials are based on the most recent Mortgage that was taken out on this home.
Original Mortgage
$68,411
Interest Rate
5.95%
Mortgage Type
FHA
Purchase Details
Closed on
Dec 19, 2000
Sold by
Pollock David D and Pollock Susan E
Bought by
Simpkins Mackey Jean
Home Financials for this Owner
Home Financials are based on the most recent Mortgage that was taken out on this home.
Original Mortgage
$48,000
Interest Rate
7.69%
Create a Home Valuation Report for This Property
The Home Valuation Report is an in-depth analysis detailing your home's value as well as a comparison with similar homes in the area
Home Values in the Area
Average Home Value in this Area
Purchase History
| Date | Buyer | Sale Price | Title Company |
|---|---|---|---|
| Steele Glenn | $90,000 | Commonwealth Land Title Insu | |
| Hammond Julia B | $69,000 | -- | |
| Simpkins Mackey Jean | $62,900 | Fidelity National Title Ins |
Source: Public Records
Mortgage History
| Date | Status | Borrower | Loan Amount |
|---|---|---|---|
| Previous Owner | Hammond Julia B | $68,411 | |
| Previous Owner | Simpkins Mackey Jean | $48,000 | |
| Closed | Simpkins Mackey Jean | $12,000 |
Source: Public Records
Tax History Compared to Growth
Tax History
| Year | Tax Paid | Tax Assessment Tax Assessment Total Assessment is a certain percentage of the fair market value that is determined by local assessors to be the total taxable value of land and additions on the property. | Land | Improvement |
|---|---|---|---|---|
| 2025 | $3,641 | $88,430 | $27,940 | $60,490 |
| 2024 | $3,641 | $88,430 | $27,940 | $60,490 |
| 2023 | $3,471 | $88,430 | $27,940 | $60,490 |
| 2022 | $3,403 | $88,430 | $27,940 | $60,490 |
| 2021 | $5,110 | $88,430 | $27,940 | $60,490 |
| 2020 | $3,435 | $52,380 | $17,000 | $35,380 |
| 2019 | $3,378 | $52,380 | $17,000 | $35,380 |
| 2018 | $3,320 | $52,380 | $0 | $0 |
| 2017 | $3,246 | $52,380 | $0 | $0 |
| 2016 | $287 | $52,380 | $0 | $0 |
| 2015 | $293 | $52,380 | $0 | $0 |
| 2014 | $293 | $52,380 | $0 | $0 |
Source: Public Records
Map
Nearby Homes
- 239 N Maple Ave
- 209 Wabash Ave
- 164 Woodland Ave
- 178 N Union Ave
- 149 Blackburn Ave
- 315 E Essex Ave
- 317 E Essex Ave
- 319 E Essex Ave
- 209 E Greenwood Ave
- 88 E Essex Ave
- 291 N Wycombe Ave
- 226 E Greenwood Ave
- 243 Coverly Rd
- 230 Wynnewood Ave
- 7247 Guilford Rd
- 75 E Stewart Ave
- 404 Croyden Rd
- 7229 Clinton Rd
- 143 Springton Rd
- 149 Springton Rd
- 221 N Maple Ave
- 217 N Maple Ave
- 215 N Maple Ave
- 225 N Maple Ave
- 213 N Maple Ave
- 211 N Maple Ave
- 218 N Wycombe Ave
- 220 N Wycombe Ave
- 216 N Wycombe Ave
- 214 N Wycombe Ave
- 222 N Wycombe Ave
- 192 E Essex Ave
- 194 E Essex Ave
- 224 N Wycombe Ave
- 196 E Essex Ave
- 209 N Maple Ave
- 198 E Essex Ave
- 212 N Wycombe Ave
- 200 E Essex Ave
- 190 E Essex Ave