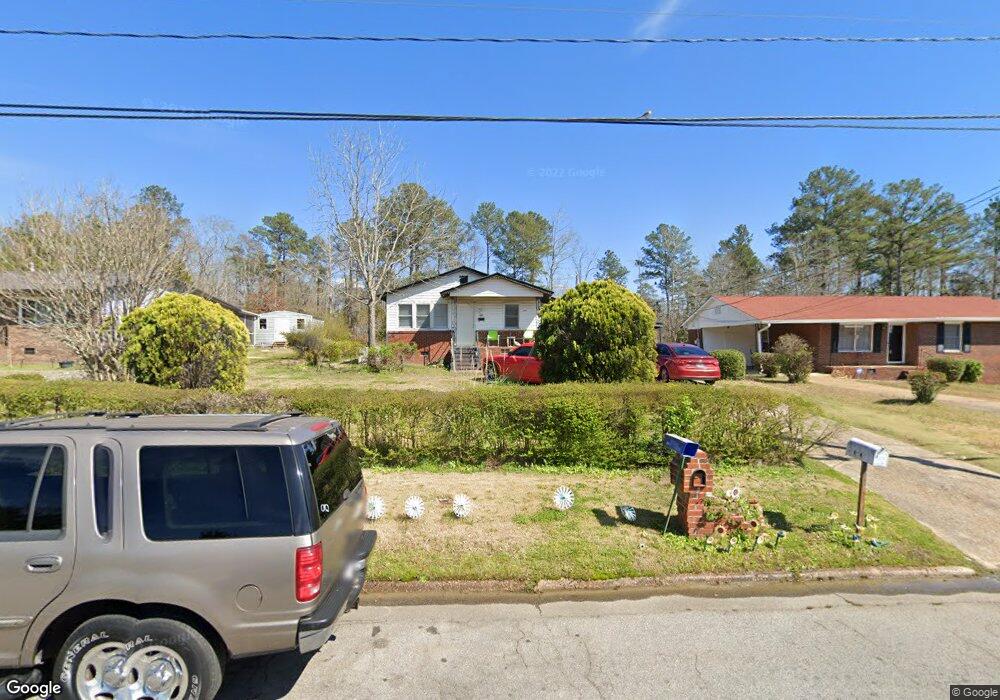
219 Niles St Lagrange, GA 30241
Estimated Value: $49,000 - $170,000
3
Beds
1
Bath
952
Sq Ft
$89/Sq Ft
Est. Value
About This Home
This home is located at 219 Niles St, Lagrange, GA 30241 and is currently estimated at $85,068, approximately $89 per square foot. 219 Niles St is a home located in Troup County with nearby schools including Hollis Hand Elementary School, Franklin Forest Elementary School, and Ethel W. Kight Elementary School.
Ownership History
Date
Name
Owned For
Owner Type
Purchase Details
Closed on
Feb 17, 2022
Sold by
Lee Julia M Fannin Executor
Bought by
Smith Toni and Smith Charles
Current Estimated Value
Purchase Details
Closed on
Jan 11, 1996
Sold by
Julia Mae Fannin
Bought by
Fannin Marie
Purchase Details
Closed on
May 1, 1981
Sold by
Marie Fannin Et-Al
Bought by
Julia Mae Fannin
Purchase Details
Closed on
Jan 1, 1971
Sold by
Don Jenkins
Bought by
Marie Fannin Et-Al
Purchase Details
Closed on
Jan 1, 1969
Sold by
Marie Roy and Marie Fannin
Bought by
Don Jenkins
Create a Home Valuation Report for This Property
The Home Valuation Report is an in-depth analysis detailing your home's value as well as a comparison with similar homes in the area
Purchase History
| Date | Buyer | Sale Price | Title Company |
|---|---|---|---|
| Smith Toni | $28,000 | -- | |
| Fannin Marie | -- | -- | |
| Julia Mae Fannin | -- | -- | |
| Marie Fannin Et-Al | -- | -- | |
| Don Jenkins | -- | -- |
Source: Public Records
Tax History
| Year | Tax Paid | Tax Assessment Tax Assessment Total Assessment is a certain percentage of the fair market value that is determined by local assessors to be the total taxable value of land and additions on the property. | Land | Improvement |
|---|---|---|---|---|
| 2025 | $485 | $17,800 | $4,880 | $12,920 |
| 2024 | $487 | $17,848 | $4,880 | $12,968 |
| 2023 | $2 | $15,652 | $4,880 | $10,772 |
| 2022 | $421 | $15,092 | $4,880 | $10,212 |
| 2021 | $416 | $13,800 | $1,600 | $12,200 |
| 2020 | $416 | $13,800 | $1,600 | $12,200 |
| 2019 | $378 | $12,536 | $1,600 | $10,936 |
| 2018 | $395 | $13,108 | $1,636 | $11,472 |
| 2017 | $395 | $13,108 | $1,636 | $11,472 |
| 2016 | $403 | $13,346 | $1,636 | $11,710 |
| 2015 | $403 | $13,346 | $1,636 | $11,710 |
| 2014 | $387 | $12,788 | $1,636 | $11,152 |
| 2013 | -- | $14,027 | $1,636 | $12,391 |
Source: Public Records
Map
Nearby Homes
Your Personal Tour Guide
Ask me questions while you tour the home.