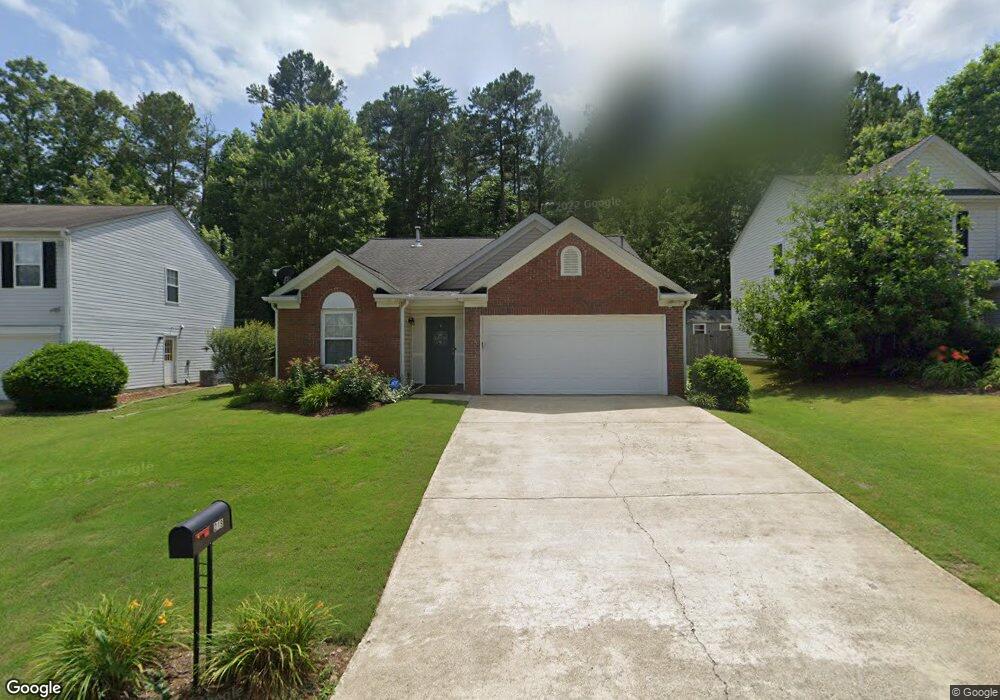
219 Picadilly Place Unit 19 Canton, GA 30114
Oak Grove NeighborhoodEstimated Value: $363,000 - $364,130
3
Beds
2
Baths
1,540
Sq Ft
$236/Sq Ft
Est. Value
About This Home
This home is located at 219 Picadilly Place Unit 19, Canton, GA 30114 and is currently estimated at $363,565, approximately $236 per square foot. 219 Picadilly Place Unit 19 is a home located in Cherokee County with nearby schools including Liberty Elementary School, Freedom Middle School, and Cherokee High School.
Ownership History
Date
Name
Owned For
Owner Type
Purchase Details
Closed on
Feb 13, 2020
Sold by
Platt Nancy H
Bought by
Shanklin Janice
Current Estimated Value
Home Financials for this Owner
Home Financials are based on the most recent Mortgage that was taken out on this home.
Original Mortgage
$197,125
Outstanding Balance
$174,168
Interest Rate
3.6%
Mortgage Type
New Conventional
Estimated Equity
$189,397
Purchase Details
Closed on
Oct 31, 2005
Sold by
Mcelderry Melanie R
Bought by
Platt Nancy H
Home Financials for this Owner
Home Financials are based on the most recent Mortgage that was taken out on this home.
Original Mortgage
$90,000
Interest Rate
5.9%
Purchase Details
Closed on
Mar 21, 2001
Sold by
Colony Homes Llc
Bought by
Mcelderry William A and Mcelderry Debra L
Home Financials for this Owner
Home Financials are based on the most recent Mortgage that was taken out on this home.
Original Mortgage
$129,752
Interest Rate
6.95%
Create a Home Valuation Report for This Property
The Home Valuation Report is an in-depth analysis detailing your home's value as well as a comparison with similar homes in the area
Home Values in the Area
Average Home Value in this Area
Purchase History
| Date | Buyer | Sale Price | Title Company |
|---|---|---|---|
| Shanklin Janice | $207,500 | -- | |
| Platt Nancy H | $149,000 | -- | |
| Mcelderry William A | $131,300 | -- |
Source: Public Records
Mortgage History
| Date | Status | Borrower | Loan Amount |
|---|---|---|---|
| Open | Shanklin Janice | $197,125 | |
| Previous Owner | Platt Nancy H | $90,000 | |
| Previous Owner | Mcelderry William A | $129,752 |
Source: Public Records
Tax History Compared to Growth
Tax History
| Year | Tax Paid | Tax Assessment Tax Assessment Total Assessment is a certain percentage of the fair market value that is determined by local assessors to be the total taxable value of land and additions on the property. | Land | Improvement |
|---|---|---|---|---|
| 2025 | $491 | $135,176 | $28,000 | $107,176 |
| 2024 | $482 | $129,628 | $28,000 | $101,628 |
| 2023 | $296 | $125,936 | $28,000 | $97,936 |
| 2022 | $381 | $93,844 | $22,000 | $71,844 |
| 2021 | $399 | $83,000 | $17,245 | $65,755 |
| 2020 | $2,280 | $74,704 | $15,600 | $59,104 |
| 2019 | $302 | $68,280 | $14,400 | $53,880 |
| 2018 | $310 | $66,400 | $14,400 | $52,000 |
| 2017 | $327 | $155,700 | $14,400 | $47,880 |
| 2016 | $327 | $141,500 | $12,000 | $44,600 |
| 2015 | $297 | $126,000 | $9,600 | $40,800 |
| 2014 | $277 | $117,900 | $9,600 | $37,560 |
Source: Public Records
Map
Nearby Homes
- 219 Picadilly Place
- 221 Picadilly Place
- 217 Picadilly Place
- 223 Picadilly Place Unit 1
- 215 Picadilly Place
- 218 Picadilly Place
- 220 Picadilly Place Unit I
- 216 Picadilly Place
- 213 Picadilly Place
- 225 Picadilly Place Unit I
- 214 Picadilly Place
- 460 Keeter Rd
- 211 Picadilly Place Unit I
- 222 Picadilly Place Unit I
- 224 Picadilly Place
- 226 Picadilly Place
- 226 Picadilly Place
- 212 Picadilly Place Unit 1
- 0 Picadilly Place Unit 7297238
- 0 Picadilly Place Unit 7474168