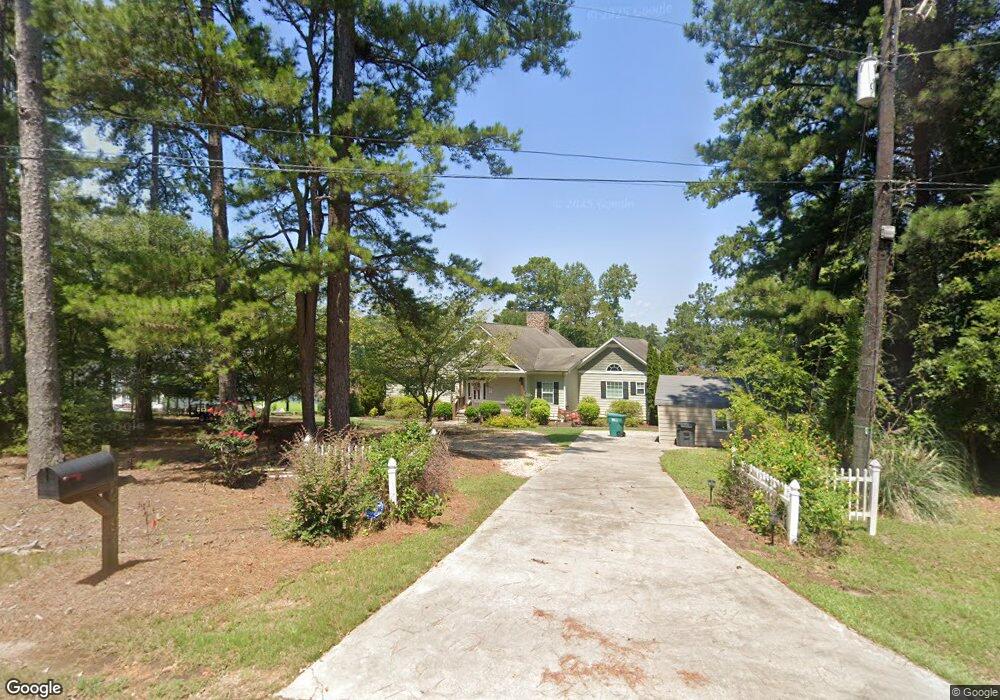
219 Pine Cone Rd NW Milledgeville, GA 31061
Estimated Value: $565,932 - $1,125,000
--
Bed
--
Bath
4,637
Sq Ft
$184/Sq Ft
Est. Value
About This Home
This home is located at 219 Pine Cone Rd NW, Milledgeville, GA 31061 and is currently estimated at $854,233, approximately $184 per square foot. 219 Pine Cone Rd NW is a home located in Baldwin County with nearby schools including Lakeview Primary, Lakeview Academy, and Oak Hill Middle School.
Ownership History
Date
Name
Owned For
Owner Type
Purchase Details
Closed on
Jun 10, 2010
Sold by
Massey William Glenn
Bought by
Massey William Glenn and Massey Linda S
Current Estimated Value
Home Financials for this Owner
Home Financials are based on the most recent Mortgage that was taken out on this home.
Original Mortgage
$340,000
Outstanding Balance
$227,197
Interest Rate
4.91%
Mortgage Type
New Conventional
Estimated Equity
$627,036
Purchase Details
Closed on
Sep 21, 2007
Sold by
Whitten Theodore R
Bought by
Massey William Glenn
Home Financials for this Owner
Home Financials are based on the most recent Mortgage that was taken out on this home.
Original Mortgage
$228,000
Interest Rate
6.49%
Mortgage Type
New Conventional
Purchase Details
Closed on
Jan 23, 2004
Sold by
Whitten Theodore R
Bought by
Whitten Bonnie
Purchase Details
Closed on
Aug 15, 2003
Sold by
Whitten Robert E
Bought by
Whitten Theodore R
Purchase Details
Closed on
Sep 10, 2001
Sold by
Smith Barry Franklin
Bought by
Whitten Robert E
Create a Home Valuation Report for This Property
The Home Valuation Report is an in-depth analysis detailing your home's value as well as a comparison with similar homes in the area
Home Values in the Area
Average Home Value in this Area
Purchase History
| Date | Buyer | Sale Price | Title Company |
|---|---|---|---|
| Massey William Glenn | -- | -- | |
| Massey William Glenn | $240,000 | -- | |
| Whitten Bonnie | -- | -- | |
| Whitten Theodore R | -- | -- | |
| Whitten Robert E | $136,300 | -- |
Source: Public Records
Mortgage History
| Date | Status | Borrower | Loan Amount |
|---|---|---|---|
| Open | Massey William Glenn | $340,000 | |
| Closed | Massey William Glenn | $228,000 |
Source: Public Records
Tax History Compared to Growth
Tax History
| Year | Tax Paid | Tax Assessment Tax Assessment Total Assessment is a certain percentage of the fair market value that is determined by local assessors to be the total taxable value of land and additions on the property. | Land | Improvement |
|---|---|---|---|---|
| 2025 | $4,108 | $168,552 | $0 | $168,552 |
| 2024 | $4,108 | $168,552 | $0 | $168,552 |
| 2023 | $3,265 | $133,956 | $0 | $133,956 |
| 2022 | $3,326 | $135,448 | $0 | $135,448 |
| 2021 | $2,288 | $87,732 | $0 | $87,732 |
| 2020 | $2,256 | $87,732 | $0 | $87,732 |
| 2019 | $2,260 | $87,732 | $0 | $87,732 |
| 2018 | $2,270 | $87,732 | $0 | $87,732 |
| 2017 | $2,237 | $87,732 | $0 | $87,732 |
| 2016 | $2,425 | $90,120 | $0 | $90,120 |
| 2015 | $2,430 | $91,160 | $0 | $91,160 |
| 2014 | $2,461 | $91,160 | $0 | $91,160 |
Source: Public Records
Map
Nearby Homes
- 108 Village Way
- 169 Admiralty Way NW
- 212 Admiralty Way
- 168 Stewart Dr NW
- 109 Misty Ln NW
- 1005 Dennis Station Rd
- 473 Riley Cir NW
- 465 Riley Cir NW
- 457 Riley Cir NW
- 110 Simmons Ln NW
- 441 Riley Cir NW
- 437 Riley Cir NW
- 433 Riley Cir NW
- 327 High Point Trail NW
- 429 Riley Cir NW
- 479 High Point Rd
- 398 Riley Cir NW
- 171 Will Place
- 223 Pine Cone Rd NW
- 215 Pine Cone Rd NW
- 212 Pine Cone Rd NW
- 213 Pine Cone Rd NW
- 225 Pine Cone Rd NW
- 211 Pine Cone Rd NW
- 209 Pine Cone Rd NW
- 205 Pine Cone Rd NW
- 117 Bot Net Rd NW
- 119 Bot Net Rd NW
- 126 Village Way NW
- 124 Village Way NW
- 193 Waits Rd NW
- 147 Bot Net Rd NW
- 125 Village Way NW
- 192 Waits Rd NW
- 123 Village Way NW
- 123 Village Way NW
- 123 Village Way NW Unit 123A-2
- 123 Village Way NW Unit 123A-2