
Seller's Agent in 2025
Debbie Mackenzie
Debbie Mackenzie Realty
4 in this area
7 Total Sales
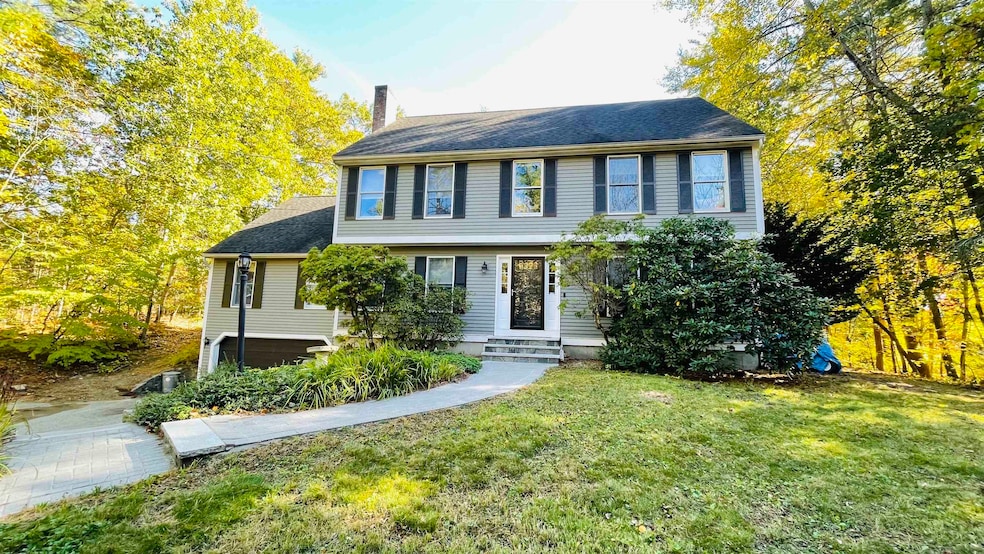
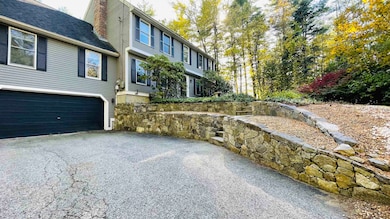
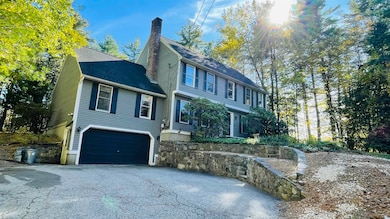
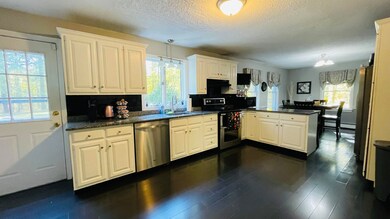
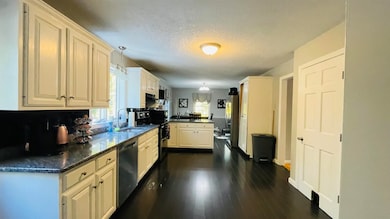
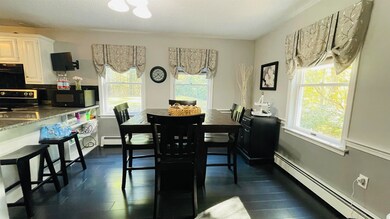
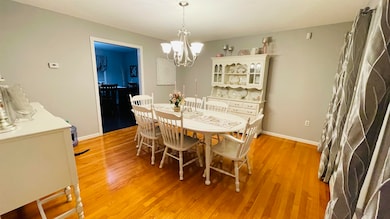
OPEN HOUSE CANCELLED! Here's your opportunity to live in sought after Windham!! Step into this spacious Garrison with private backyard and oversized deck perfect for entertaining! Eat-in kitchen and formal dining room, plus fireplaced formal living room and huge family room make this the perfect home! Your family room has cathedral ceilings, recessed lights, ceiling fan and french doors to the deck. The primary bedroom includes a three quarter bath and his and her closets. There's plenty of room to grow when you have the added finished walkup attic. This won't last at this price so call for your private showing!
Last Agent to Sell the Property
Debbie Mackenzie Realty Brokerage Phone: 603-560-1842 License #056496 Listed on: 10/19/2025
| Date | Type | Sale Price | Title Company |
|---|---|---|---|
| Warranty Deed | $715,000 | -- | |
| Warranty Deed | $715,000 | -- | |
| Warranty Deed | $360,000 | -- |
| Date | Status | Loan Amount | Loan Type |
|---|---|---|---|
| Open | $380,000 | Purchase Money Mortgage | |
| Closed | $380,000 | Purchase Money Mortgage | |
| Previous Owner | $70,000 | Unknown | |
| Previous Owner | $225,900 | Purchase Money Mortgage |
| Date | Event | Price | List to Sale | Price per Sq Ft |
|---|---|---|---|---|
| 12/15/2025 12/15/25 | Sold | $715,000 | +2.2% | $264 / Sq Ft |
| 10/25/2025 10/25/25 | Pending | -- | -- | -- |
| 10/19/2025 10/19/25 | For Sale | $699,900 | -- | $259 / Sq Ft |
| Year | Tax Paid | Tax Assessment Tax Assessment Total Assessment is a certain percentage of the fair market value that is determined by local assessors to be the total taxable value of land and additions on the property. | Land | Improvement |
|---|---|---|---|---|
| 2024 | $8,827 | $389,900 | $136,300 | $253,600 |
| 2023 | $8,344 | $389,900 | $136,300 | $253,600 |
| 2022 | $7,704 | $389,900 | $136,300 | $253,600 |
| 2021 | $7,267 | $390,300 | $136,300 | $254,000 |
| 2020 | $7,466 | $390,300 | $136,300 | $254,000 |
| 2019 | $7,020 | $311,300 | $125,300 | $186,000 |
| 2018 | $7,250 | $311,300 | $125,300 | $186,000 |
| 2017 | $6,288 | $311,300 | $125,300 | $186,000 |
| 2016 | $6,793 | $311,300 | $125,300 | $186,000 |
| 2015 | $6,761 | $311,300 | $125,300 | $186,000 |
| 2014 | $7,716 | $321,500 | $156,000 | $165,500 |
| 2013 | $7,514 | $318,400 | $156,000 | $162,400 |
Seller's Agent in 2025
Debbie Mackenzie
Debbie Mackenzie Realty
4 in this area
7 Total Sales
Buyer's Agent in 2025
Joe Zingales
Team Zingales Realty LLC
(978) 991-5688
1 in this area
46 Total Sales
Source: PrimeMLS
MLS Number: 5066399
APN: WNDM-000021-G000000-000039
Disclaimer: Certain information contained herein is derived from information provided by parties other than Homes.com. All information provided is deemed reliable, but is not guaranteed to be accurate and should be independently verified.
![]() Copyright 2026 PrimeMLS, Inc. All rights reserved. This information is deemed reliable, but not guaranteed. The data relating to real estate displayed on this display comes in part from the IDX Program of PrimeMLS. The information being provided is for consumers’ personal, non-commercial use and may not be used for any purpose other than to identify prospective properties consumers may be interested in purchasing.
Copyright 2026 PrimeMLS, Inc. All rights reserved. This information is deemed reliable, but not guaranteed. The data relating to real estate displayed on this display comes in part from the IDX Program of PrimeMLS. The information being provided is for consumers’ personal, non-commercial use and may not be used for any purpose other than to identify prospective properties consumers may be interested in purchasing.
Ask me questions while you tour the home.