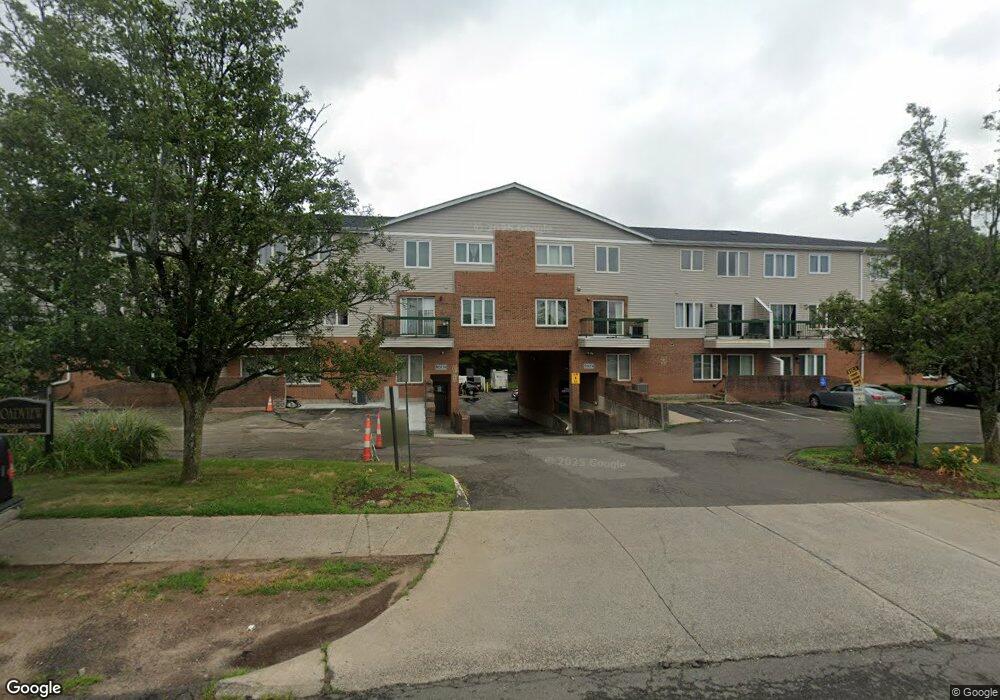
Broadview Condominium 219 S Broad St Unit S209 Meriden, CT 06450
Estimated Value: $163,000 - $215,000
2
Beds
2
Baths
1,167
Sq Ft
$153/Sq Ft
Est. Value
About This Home
This home is located at 219 S Broad St Unit S209, Meriden, CT 06450 and is currently estimated at $178,821, approximately $153 per square foot. 219 S Broad St Unit S209 is a home located in New Haven County with nearby schools including Israel Putnam School, Washington Middle School, and Francis T. Maloney High School.
Ownership History
Date
Name
Owned For
Owner Type
Purchase Details
Closed on
Sep 27, 2004
Sold by
Rodriguez Ricardo
Bought by
Tremont James
Current Estimated Value
Home Financials for this Owner
Home Financials are based on the most recent Mortgage that was taken out on this home.
Original Mortgage
$94,500
Interest Rate
5.89%
Purchase Details
Closed on
Oct 12, 2001
Sold by
Coley Hazel and Coley Delancey
Bought by
Rodriguez Ricardo
Purchase Details
Closed on
Jun 15, 2000
Sold by
Schumann Jennifer and Schumann Stefan
Bought by
Coley Hazel and Coley Delancey
Purchase Details
Closed on
Nov 1, 1995
Sold by
Ru Assoc Dev
Bought by
Schumann Stefan and Schumann Jennifer
Purchase Details
Closed on
May 11, 1995
Sold by
Fgb Rlty Advisors Inc
Bought by
Ru Assoc Inc
Create a Home Valuation Report for This Property
The Home Valuation Report is an in-depth analysis detailing your home's value as well as a comparison with similar homes in the area
Home Values in the Area
Average Home Value in this Area
Purchase History
| Date | Buyer | Sale Price | Title Company |
|---|---|---|---|
| Tremont James | $94,500 | -- | |
| Rodriguez Ricardo | $49,900 | -- | |
| Coley Hazel | $34,500 | -- | |
| Schumann Stefan | $40,000 | -- | |
| Ru Assoc Inc | $24,500 | -- |
Source: Public Records
Mortgage History
| Date | Status | Borrower | Loan Amount |
|---|---|---|---|
| Closed | Ru Assoc Inc | $50,000 | |
| Open | Ru Assoc Inc | $96,000 | |
| Closed | Ru Assoc Inc | $94,500 |
Source: Public Records
Tax History Compared to Growth
Tax History
| Year | Tax Paid | Tax Assessment Tax Assessment Total Assessment is a certain percentage of the fair market value that is determined by local assessors to be the total taxable value of land and additions on the property. | Land | Improvement |
|---|---|---|---|---|
| 2024 | $1,827 | $50,330 | $0 | $50,330 |
| 2023 | $1,751 | $50,330 | $0 | $50,330 |
| 2022 | $1,660 | $50,330 | $0 | $50,330 |
| 2021 | $2,251 | $55,090 | $0 | $55,090 |
| 2020 | $2,251 | $55,090 | $0 | $55,090 |
| 2019 | $2,251 | $55,090 | $0 | $55,090 |
| 2018 | $2,261 | $55,090 | $0 | $55,090 |
| 2017 | $2,199 | $55,090 | $0 | $55,090 |
| 2016 | $2,613 | $71,330 | $0 | $71,330 |
| 2015 | $2,613 | $71,330 | $0 | $71,330 |
| 2014 | $2,549 | $71,330 | $0 | $71,330 |
Source: Public Records
About Broadview Condominium
Map
Nearby Homes
- 219 S Broad St Unit N217
- 219 S Broad St Unit N205
- 23 Davis St
- 86 Applewood Dr
- 36 Broad St
- 34 Meetinghouse Ridge
- 328 Curtis St
- 71 Broad St
- 104 Gale Ave
- 54 Meetinghouse Village Unit 2
- 61 Meetinghouse Village Unit 4
- 1012 Old Colony Rd Unit LOT 54
- 1012 Old Colony Rd Unit 85
- 1012 Old Colony Rd Unit LOT 118
- 73 Lanouette Street Extension
- 530 Yale Ave
- 293 New Hanover Ave
- 560 Yale Ave Unit 5
- 560 Yale Ave Unit 135
- 560 Yale Ave Unit 209
- 219 S Broad St Unit S219
- 219 S Broad St Unit S218
- 219 S Broad St Unit S217
- 219 S Broad St Unit S216
- 219 S Broad St Unit S215
- 219 S Broad St Unit S214
- 219 S Broad St Unit S213
- 219 S Broad St Unit S212
- 219 S Broad St Unit S211
- 219 S Broad St Unit S210
- 219 S Broad St Unit S208
- 219 S Broad St Unit S207
- 219 S Broad St Unit S206
- 219 S Broad St Unit S205
- 219 S Broad St Unit S204
- 219 S Broad St Unit S203
- 219 S Broad St Unit S202
- 219 S Broad St Unit S201
- 219 S Broad St Unit S110
- 219 S Broad St Unit S109