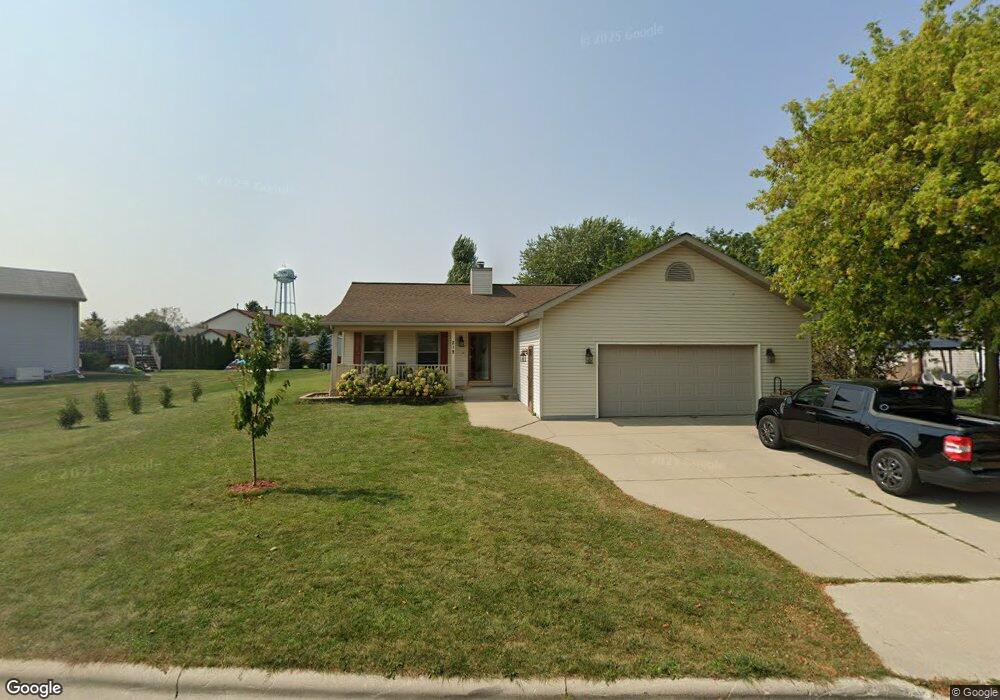
219 S Lar Ann St Belgium, WI 53004
Estimated Value: $327,000 - $369,000
3
Beds
2
Baths
1,458
Sq Ft
$242/Sq Ft
Est. Value
About This Home
This home is located at 219 S Lar Ann St, Belgium, WI 53004 and is currently estimated at $353,152, approximately $242 per square foot. 219 S Lar Ann St is a home located in Ozaukee County with nearby schools including Cedar Grove-Belgium Elementary School, Cedar Grove-Belgium Middle School, and Cedar Grove-Belgium High School.
Ownership History
Date
Name
Owned For
Owner Type
Purchase Details
Closed on
Jun 17, 2022
Sold by
R. Neumyer Matthew and R. M. Alyssa
Bought by
Morgan Fincher
Current Estimated Value
Purchase Details
Closed on
Dec 8, 2017
Sold by
Krizek Aaron T
Bought by
Neumeyer Matthew R and Neumeyer Alyssa R
Home Financials for this Owner
Home Financials are based on the most recent Mortgage that was taken out on this home.
Original Mortgage
$199,323
Interest Rate
3.87%
Mortgage Type
FHA
Purchase Details
Closed on
Apr 18, 2013
Sold by
Us Bank Na
Bought by
Krizek Aaron T
Home Financials for this Owner
Home Financials are based on the most recent Mortgage that was taken out on this home.
Original Mortgage
$120,000
Interest Rate
3.51%
Mortgage Type
New Conventional
Purchase Details
Closed on
Oct 16, 2012
Sold by
Spain Robert H and Spain Waynette T
Bought by
Us Bank Na
Create a Home Valuation Report for This Property
The Home Valuation Report is an in-depth analysis detailing your home's value as well as a comparison with similar homes in the area
Home Values in the Area
Average Home Value in this Area
Purchase History
| Date | Buyer | Sale Price | Title Company |
|---|---|---|---|
| Morgan Fincher | $300,000 | Kbta 2151187 | |
| Neumeyer Matthew R | $203,000 | -- | |
| Krizek Aaron T | $132,000 | None Available | |
| Us Bank Na | -- | None Available |
Source: Public Records
Mortgage History
| Date | Status | Borrower | Loan Amount |
|---|---|---|---|
| Previous Owner | Neumeyer Matthew R | $199,323 | |
| Previous Owner | Krizek Aaron T | $120,000 |
Source: Public Records
Tax History Compared to Growth
Tax History
| Year | Tax Paid | Tax Assessment Tax Assessment Total Assessment is a certain percentage of the fair market value that is determined by local assessors to be the total taxable value of land and additions on the property. | Land | Improvement |
|---|---|---|---|---|
| 2024 | $4,006 | $304,300 | $31,200 | $273,100 |
| 2023 | $3,595 | $195,500 | $22,300 | $173,200 |
| 2022 | $3,421 | $195,500 | $22,300 | $173,200 |
| 2021 | $3,286 | $195,500 | $22,300 | $173,200 |
| 2020 | $3,423 | $195,500 | $22,300 | $173,200 |
| 2019 | $3,385 | $195,500 | $22,300 | $173,200 |
| 2018 | $3,449 | $195,500 | $22,300 | $173,200 |
| 2017 | $3,196 | $172,600 | $21,000 | $151,600 |
| 2016 | $3,130 | $176,900 | $22,300 | $154,600 |
| 2015 | $3,011 | $176,900 | $22,300 | $154,600 |
| 2014 | $3,197 | $221,900 | $37,100 | $184,800 |
| 2013 | $3,353 | $221,900 | $37,100 | $184,800 |
Source: Public Records
Map
Nearby Homes
- 261 Main St Unit 263
- 354 S Heritage St
- 267 Michael St
- Lt3 Birchwood St
- Nottingham II Plan at Maple Lawn
- Highlander Plan at Maple Lawn
- Sarah II Plan at Maple Lawn
- Isabelle II Plan at Maple Lawn
- Rivermor - Duplex Plan at Maple Lawn
- Elizabeth II Plan at Maple Lawn
- Ashton II - Duplex Plan at Maple Lawn
- Lilac - Duplex Plan at Maple Lawn
- Barbara Plan at Maple Lawn
- Aster - Duplex Plan at Maple Lawn
- Sonja Plan at Maple Lawn
- Montrose Manor II Plan at Maple Lawn
- Hamilton Plan at Maple Lawn
- Vintage 1A Plan at Maple Lawn
- Isabelle Plan at Maple Lawn
- Coventry II Plan at Maple Lawn
- 219 S Lar-Ann St
- 211 Spring St
- 237 S Lar Ann St
- 229 Spring St
- 224 Tower Dr
- 238 Tower Dr
- 245 Spring St
- 183 S Lar Ann St
- 226 Spring St
- 262 S Lar-Ann St
- 262 S Lar-Ann St Unit 2
- 250 Tower Dr
- 231 Tower Dr
- 259 Spring St
- 265 S Lar Ann St
- 158 Spring St
- 240 Spring St
- 169 S Lar Ann St
- 170 S Lar Ann St
- 243 Tower Dr