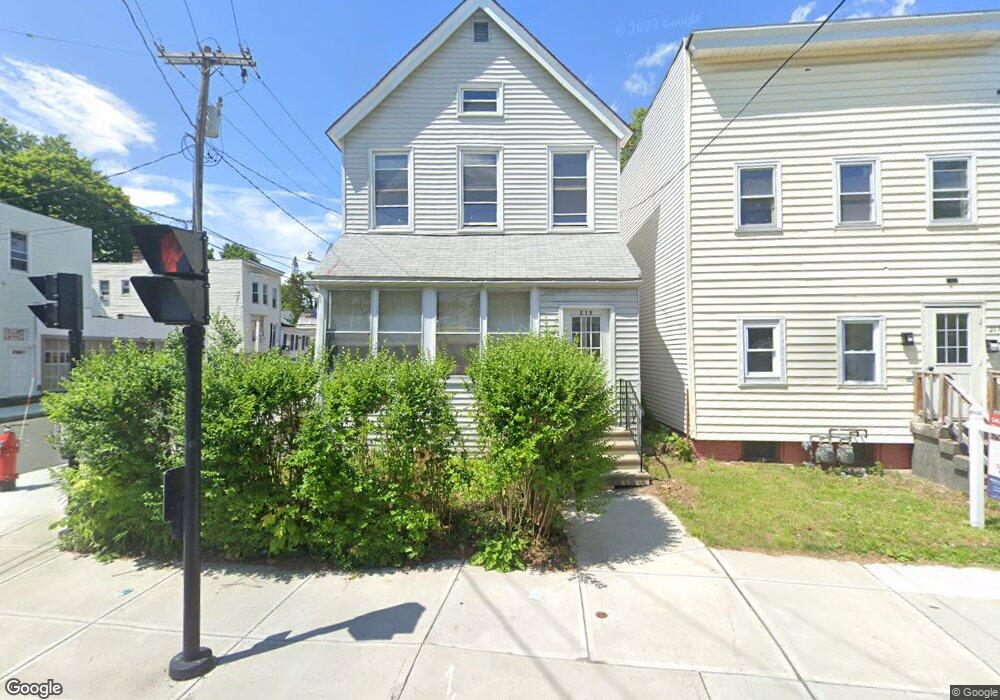
219 Second Ave Albany, NY 12202
Second Avenue NeighborhoodEstimated Value: $128,000 - $215,125
4
Beds
2
Baths
1,544
Sq Ft
$122/Sq Ft
Est. Value
About This Home
This home is located at 219 Second Ave, Albany, NY 12202 and is currently estimated at $187,781, approximately $121 per square foot. 219 Second Ave is a home located in Albany County with nearby schools including Delaware Community School, William S Hackett Middle School, and Albany High School.
Ownership History
Date
Name
Owned For
Owner Type
Purchase Details
Closed on
Apr 7, 2022
Sold by
Torres Rita M
Bought by
Thomas Noel R
Current Estimated Value
Purchase Details
Closed on
May 18, 2005
Sold by
Mcgowan Peter M
Bought by
Torres Rita
Home Financials for this Owner
Home Financials are based on the most recent Mortgage that was taken out on this home.
Original Mortgage
$48,700
Interest Rate
8.37%
Mortgage Type
Adjustable Rate Mortgage/ARM
Purchase Details
Closed on
Jan 3, 1999
Sold by
Albany Comm Devel Agency
Bought by
Urban Leage N E New York
Purchase Details
Closed on
Oct 16, 1996
Create a Home Valuation Report for This Property
The Home Valuation Report is an in-depth analysis detailing your home's value as well as a comparison with similar homes in the area
Home Values in the Area
Average Home Value in this Area
Purchase History
| Date | Buyer | Sale Price | Title Company |
|---|---|---|---|
| Thomas Noel R | $130,000 | None Listed On Document | |
| Torres Rita | $49,000 | -- | |
| Urban Leage N E New York | -- | -- | |
| -- | $19,000 | -- |
Source: Public Records
Mortgage History
| Date | Status | Borrower | Loan Amount |
|---|---|---|---|
| Previous Owner | Torres Rita | $48,700 |
Source: Public Records
Tax History
| Year | Tax Paid | Tax Assessment Tax Assessment Total Assessment is a certain percentage of the fair market value that is determined by local assessors to be the total taxable value of land and additions on the property. | Land | Improvement |
|---|---|---|---|---|
| 2025 | $3,893 | $149,000 | $29,800 | $119,200 |
| 2024 | $3,893 | $149,000 | $29,800 | $119,200 |
| 2023 | $4,111 | $102,000 | $20,400 | $81,600 |
| 2022 | $4,021 | $102,000 | $20,400 | $81,600 |
| 2021 | $4,012 | $102,000 | $20,400 | $81,600 |
| 2020 | $3,870 | $102,000 | $20,400 | $81,600 |
| 2019 | $4,016 | $102,000 | $20,400 | $81,600 |
| 2018 | $3,879 | $102,000 | $20,400 | $81,600 |
| 2017 | $3,853 | $102,000 | $20,400 | $81,600 |
| 2016 | $3,762 | $102,000 | $20,400 | $81,600 |
| 2015 | $2,336 | $105,000 | $21,000 | $84,000 |
| 2014 | -- | $105,000 | $21,000 | $84,000 |
Source: Public Records
Map
Nearby Homes
Your Personal Tour Guide
Ask me questions while you tour the home.