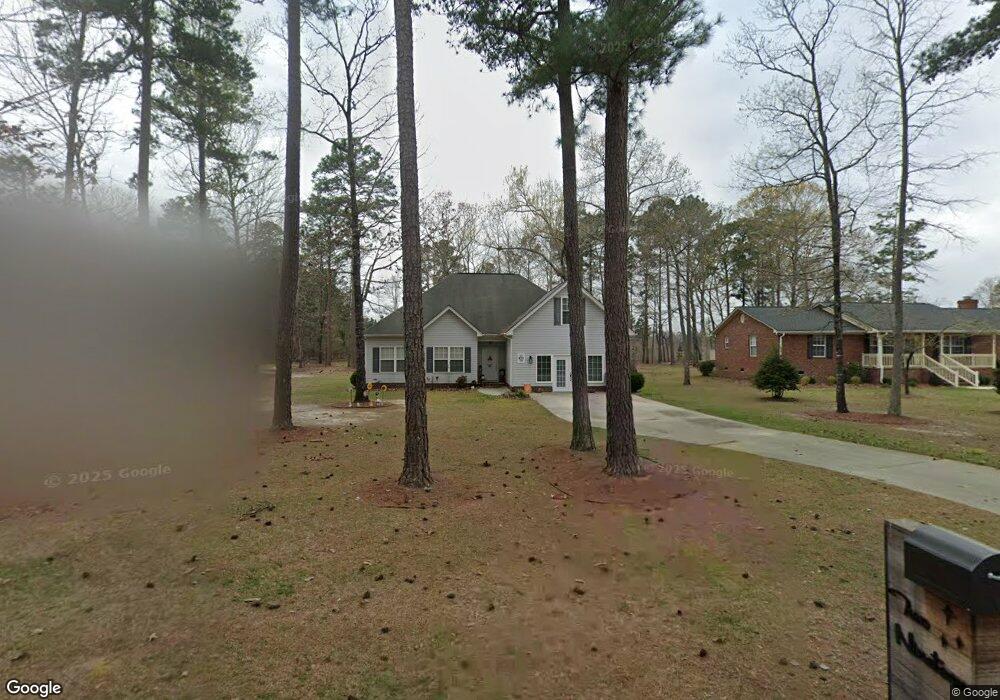
219 Sorin Cir Elloree, SC 29047
Estimated Value: $336,000 - $368,000
3
Beds
2
Baths
1,813
Sq Ft
$197/Sq Ft
Est. Value
About This Home
This home is located at 219 Sorin Cir, Elloree, SC 29047 and is currently estimated at $356,333, approximately $196 per square foot. 219 Sorin Cir is a home located in Orangeburg County with nearby schools including Elloree Elementary and Lake Marion High School.
Ownership History
Date
Name
Owned For
Owner Type
Purchase Details
Closed on
Oct 10, 2018
Sold by
Hirt Steven K
Bought by
Blankenship Charles Scott
Current Estimated Value
Home Financials for this Owner
Home Financials are based on the most recent Mortgage that was taken out on this home.
Original Mortgage
$181,649
Outstanding Balance
$158,409
Interest Rate
4.5%
Mortgage Type
FHA
Estimated Equity
$197,924
Purchase Details
Closed on
Dec 21, 2011
Sold by
Estate Of Donna M Hirt and Hirt Steve K
Bought by
Hirt Steven K
Purchase Details
Closed on
Sep 7, 2007
Sold by
Roland Builders Of Santee Inc
Bought by
Hirt Steven K and Hirt Donna M
Purchase Details
Closed on
Mar 15, 2007
Sold by
Brady Scott and Callahan Kevin
Bought by
Roland Builders Of Santee Inc
Purchase Details
Closed on
Mar 14, 2007
Sold by
Gaffney Thomas J and Hendrickson Robert H
Bought by
Brady Scott and Callahan Kevin
Create a Home Valuation Report for This Property
The Home Valuation Report is an in-depth analysis detailing your home's value as well as a comparison with similar homes in the area
Purchase History
| Date | Buyer | Sale Price | Title Company |
|---|---|---|---|
| Blankenship Charles Scott | $185,000 | None Available | |
| Hirt Steven K | -- | -- | |
| Hirt Steven K | $156,000 | None Available | |
| Roland Builders Of Santee Inc | $12,000 | None Available | |
| Brady Scott | $3,000 | None Available |
Source: Public Records
Mortgage History
| Date | Status | Borrower | Loan Amount |
|---|---|---|---|
| Open | Blankenship Charles Scott | $181,649 |
Source: Public Records
Tax History
| Year | Tax Paid | Tax Assessment Tax Assessment Total Assessment is a certain percentage of the fair market value that is determined by local assessors to be the total taxable value of land and additions on the property. | Land | Improvement |
|---|---|---|---|---|
| 2024 | $1,429 | $7,430 | $360 | $7,070 |
| 2023 | $1,265 | $9,698 | $608 | $9,090 |
| 2022 | $1,233 | $9,698 | $608 | $9,090 |
| 2021 | $1,213 | $9,698 | $608 | $9,090 |
| 2020 | $1,187 | $9,698 | $0 | $0 |
| 2019 | $1,194 | $9,698 | $0 | $0 |
| 2018 | $1,063 | $7,706 | $0 | $0 |
| 2017 | $1,053 | $7,706 | $0 | $0 |
| 2016 | $1,033 | $7,706 | $0 | $0 |
| 2015 | $992 | $7,706 | $0 | $0 |
| 2014 | $992 | $7,706 | $608 | $7,098 |
| 2013 | -- | $5,525 | $405 | $5,120 |
Source: Public Records
Map
Nearby Homes
- 0 Sorin Cir
- 138 Twisted Oak Trail
- 147 Twisted Oak Trail
- 119 Twisted Oak Trail
- 113 Twisted Oak Trail
- 1595 Old River Rd
- 343 Pinewood Dr
- 1621 Old River Rd
- 20 Thunder Cir
- 30 Poplar Creek Dr
- 0 Poplar Creek Dr Unit 25028030
- 209 Partridge Run Rd
- 0 Breezewood Unit 615215
- 0 Breezewood Unit 25015998
- 756 Santee River Rd
- 0 Old River Rd
- 1510 Tee Vee Rd
- 49 Poplar Landing Ln
- 1060 Quail Path Rd
- 1060 Quail Path Rd Unit Lot 56
- 219 Sorin Cir
- 223 Sorin Cir
- 229 Sorin Cir
- 116 Sorin Cir
- 235 Sorin Cir
- 236 Sorin Cir
- 201 Sorin Cir
- 1229 Cleveland St
- 119 Sorin Cir
- 46 Sorin Cir
- 48 Sorin Cir
- Lot 54 Sorin Cir
- 40 Sorin Cir Unit LOT 40
- 40 Sorin Cir Unit LOT
- 54 Sorin Cir
- 123 Sorin Cir
- 1237 Cleveland St
- 105 Sorin Cir
- 1245 Cleveland St
- 59 Sorin Cir
Your Personal Tour Guide
Ask me questions while you tour the home.