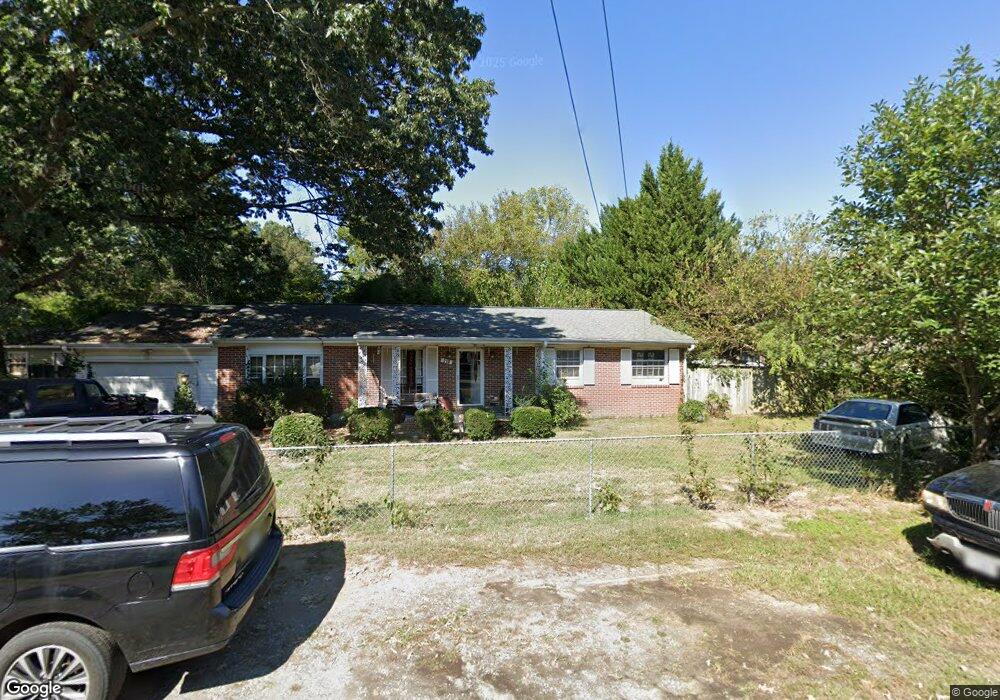
219 Third St Colonial Beach, VA 22443
Estimated Value: $288,000 - $344,000
3
Beds
2
Baths
1,325
Sq Ft
$244/Sq Ft
Est. Value
About This Home
This home is located at 219 Third St, Colonial Beach, VA 22443 and is currently estimated at $323,168, approximately $243 per square foot. 219 Third St is a home located in Westmoreland County with nearby schools including Colonial Beach Elementary School and Colonial Beach High School.
Ownership History
Date
Name
Owned For
Owner Type
Purchase Details
Closed on
Jun 14, 2013
Sold by
Lee Roy A
Bought by
Rodgers Troy
Current Estimated Value
Home Financials for this Owner
Home Financials are based on the most recent Mortgage that was taken out on this home.
Original Mortgage
$127,645
Outstanding Balance
$90,928
Interest Rate
3.75%
Mortgage Type
FHA
Estimated Equity
$232,240
Purchase Details
Closed on
Apr 2, 2009
Sold by
Us Bank Na
Bought by
Lee Roy A
Purchase Details
Closed on
Oct 27, 2008
Sold by
Samuel I White P C and Saunders Edward
Bought by
Us Bank National Association
Create a Home Valuation Report for This Property
The Home Valuation Report is an in-depth analysis detailing your home's value as well as a comparison with similar homes in the area
Home Values in the Area
Average Home Value in this Area
Purchase History
| Date | Buyer | Sale Price | Title Company |
|---|---|---|---|
| Rodgers Troy | $130,000 | -- | |
| Lee Roy A | $109,000 | -- | |
| Us Bank National Association | $140,250 | -- |
Source: Public Records
Mortgage History
| Date | Status | Borrower | Loan Amount |
|---|---|---|---|
| Open | Us Bank National Association | $127,645 |
Source: Public Records
Tax History
| Year | Tax Paid | Tax Assessment Tax Assessment Total Assessment is a certain percentage of the fair market value that is determined by local assessors to be the total taxable value of land and additions on the property. | Land | Improvement |
|---|---|---|---|---|
| 2025 | $711 | $169,300 | $55,800 | $113,500 |
| 2024 | $711 | $169,300 | $55,800 | $113,500 |
| 2023 | $677 | $169,300 | $55,800 | $113,500 |
| 2022 | $677 | $169,300 | $55,800 | $113,500 |
| 2021 | $664 | $146,000 | $55,800 | $90,200 |
| 2020 | $686 | $146,000 | $55,800 | $90,200 |
| 2018 | $584 | $146,000 | $55,800 | $90,200 |
| 2017 | -- | $146,000 | $55,800 | $90,200 |
| 2016 | $569 | $146,000 | $55,800 | $90,200 |
| 2015 | -- | $154,100 | $55,800 | $98,300 |
| 2014 | -- | $0 | $0 | $0 |
| 2013 | -- | $154,100 | $55,800 | $98,300 |
Source: Public Records
Map
Nearby Homes
Your Personal Tour Guide
Ask me questions while you tour the home.