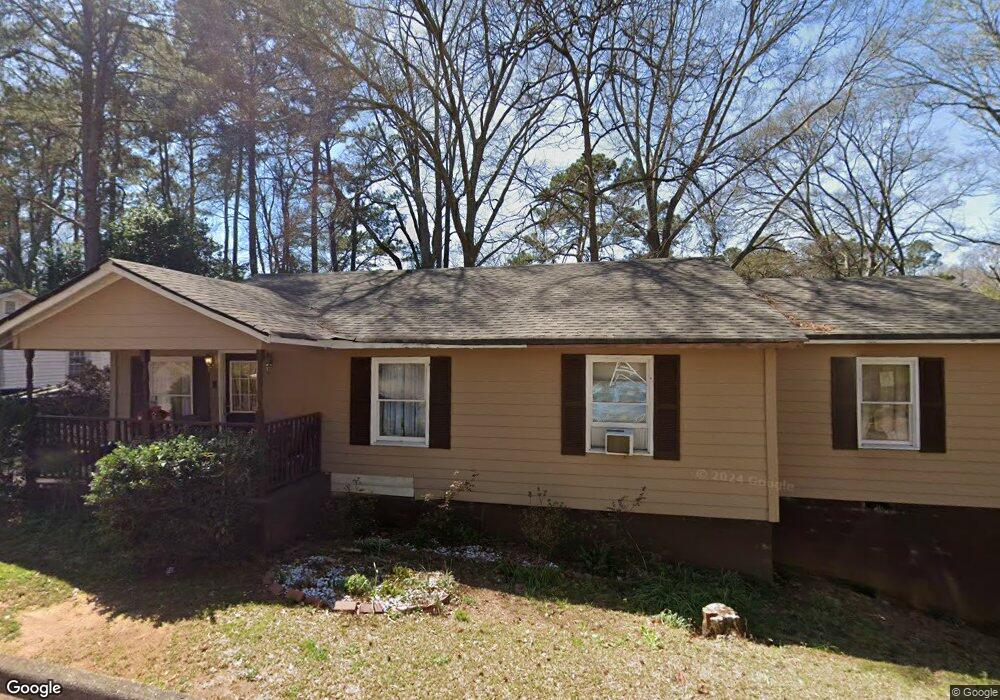
219 Thomas St Lagrange, GA 30240
Estimated Value: $120,000 - $179,000
3
Beds
1
Bath
1,420
Sq Ft
$98/Sq Ft
Est. Value
About This Home
This home is located at 219 Thomas St, Lagrange, GA 30240 and is currently estimated at $139,172, approximately $98 per square foot. 219 Thomas St is a home located in Troup County with nearby schools including Franklin Forest Elementary School, Hollis Hand Elementary School, and Ethel W. Kight Elementary School.
Ownership History
Date
Name
Owned For
Owner Type
Purchase Details
Closed on
Mar 26, 2009
Sold by
Kelley Veronical S
Bought by
Kelley Veronical S
Current Estimated Value
Home Financials for this Owner
Home Financials are based on the most recent Mortgage that was taken out on this home.
Original Mortgage
$47,559
Outstanding Balance
$29,997
Interest Rate
5.14%
Mortgage Type
New Conventional
Estimated Equity
$109,175
Purchase Details
Closed on
Dec 4, 2003
Sold by
William A Kelley
Bought by
Kelley Vernonical
Purchase Details
Closed on
Mar 30, 2000
Sold by
Mallory Realty Co Inc
Bought by
William A Kelley
Purchase Details
Closed on
Sep 1, 1970
Sold by
Mrs Martha C Hadaway
Bought by
Mallory Realty Co Inc
Purchase Details
Closed on
Jan 1, 1950
Sold by
Mrs Georgia A Bradfield
Bought by
Mrs Martha C Hadaway
Create a Home Valuation Report for This Property
The Home Valuation Report is an in-depth analysis detailing your home's value as well as a comparison with similar homes in the area
Purchase History
| Date | Buyer | Sale Price | Title Company |
|---|---|---|---|
| Kelley Veronical S | -- | -- | |
| Kelley Veronical S | -- | -- | |
| Kelley Vernonical | -- | -- | |
| William A Kelley | $5,500 | -- | |
| Mallory Realty Co Inc | -- | -- | |
| Mrs Martha C Hadaway | -- | -- |
Source: Public Records
Mortgage History
| Date | Status | Borrower | Loan Amount |
|---|---|---|---|
| Open | Kelley Veronical S | $47,559 | |
| Closed | Kelley Veronical S | $47,559 |
Source: Public Records
Tax History
| Year | Tax Paid | Tax Assessment Tax Assessment Total Assessment is a certain percentage of the fair market value that is determined by local assessors to be the total taxable value of land and additions on the property. | Land | Improvement |
|---|---|---|---|---|
| 2025 | $803 | $35,280 | $480 | $34,800 |
| 2024 | $803 | $31,440 | $480 | $30,960 |
| 2023 | $599 | $23,960 | $480 | $23,480 |
| 2022 | $564 | $22,200 | $480 | $21,720 |
| 2021 | $437 | $16,480 | $480 | $16,000 |
| 2020 | $437 | $16,480 | $480 | $16,000 |
| 2019 | $412 | $15,640 | $680 | $14,960 |
| 2018 | $412 | $15,640 | $680 | $14,960 |
| 2017 | $412 | $15,640 | $680 | $14,960 |
| 2016 | $405 | $15,403 | $680 | $14,723 |
| 2015 | $400 | $15,220 | $498 | $14,723 |
| 2014 | $377 | $14,446 | $498 | $13,948 |
| 2013 | -- | $14,792 | $512 | $14,280 |
Source: Public Records
Map
Nearby Homes
- 109 Thomas St
- 219 Banks St
- 222 Beechwood Cir
- 900 North St
- 110 Russell St
- 0 Ridley Ave Unit 10550104
- 609 Ridley Ave
- 707 Ridley Ave
- 611 Ridley Ave
- 615 Ridley Ave
- 709 Ridley Ave
- 202 Park Hill Dr
- 204 Colonial St
- 102 Dogwood Dr
- 301 E Bacon St
- 106 Ewing St
- 806 New Franklin Rd
- 120 Saynor Cir
- 724 Camellia Dr
- 105 Saynor Cir
- 217 Thomas St
- 220 Thomas St
- 215 Thomas St
- 213 Thomas St
- 217 Banks St
- 211 Thomas St
- 734 N Greenwood St
- 215 Banks St
- 210 Thomas St
- 732 N Greenwood St Unit 4
- 732 N Greenwood St
- 213 Banks St
- 730 N Greenwood St
- 736 N Greenwood St
- 209 Thomas St
- 127 Cox St
- 123 Cox St
- 728 N Greenwood St
- 211 Banks St
- 121 Cox St
Your Personal Tour Guide
Ask me questions while you tour the home.