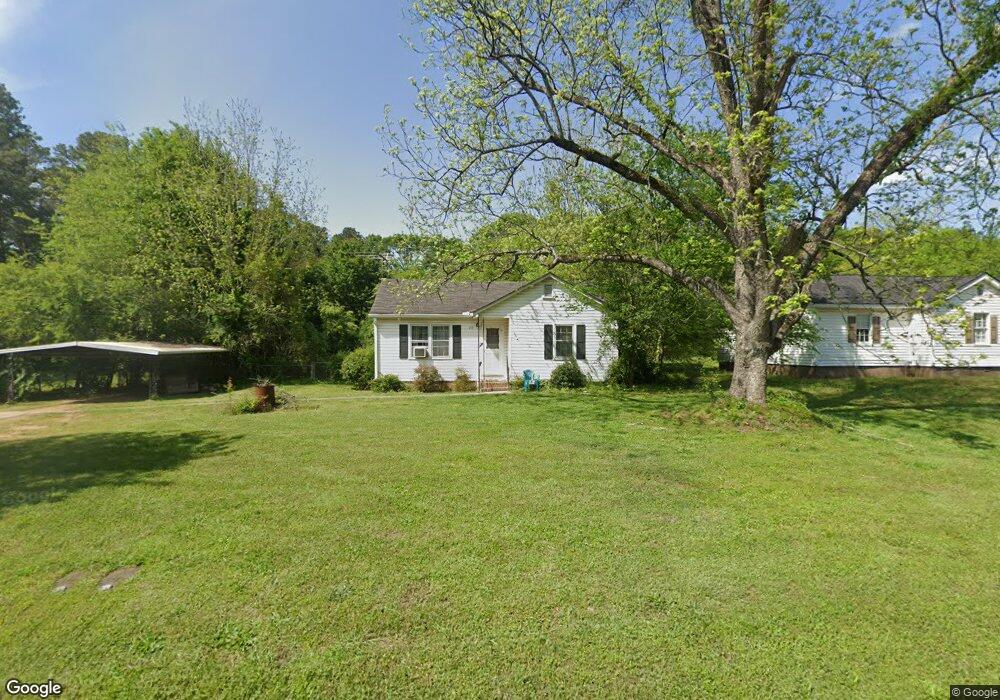
219 Vineyard Rd Griffin, GA 30223
Spalding County NeighborhoodEstimated Value: $109,632 - $150,000
2
Beds
1
Bath
964
Sq Ft
$135/Sq Ft
Est. Value
About This Home
This home is located at 219 Vineyard Rd, Griffin, GA 30223 and is currently estimated at $130,158, approximately $135 per square foot. 219 Vineyard Rd is a home located in Spalding County with nearby schools including Cowan Road Elementary School, Cowan Road Middle School, and Griffin High School.
Ownership History
Date
Name
Owned For
Owner Type
Purchase Details
Closed on
May 29, 2008
Sold by
Stanley Sara M
Bought by
Feeney Vickie D
Current Estimated Value
Home Financials for this Owner
Home Financials are based on the most recent Mortgage that was taken out on this home.
Original Mortgage
$62,814
Outstanding Balance
$39,914
Interest Rate
5.86%
Mortgage Type
FHA
Estimated Equity
$90,244
Purchase Details
Closed on
Apr 18, 2008
Sold by
Ballard Marvin C
Bought by
Stanley Sara M
Home Financials for this Owner
Home Financials are based on the most recent Mortgage that was taken out on this home.
Original Mortgage
$62,814
Outstanding Balance
$39,914
Interest Rate
5.86%
Mortgage Type
FHA
Estimated Equity
$90,244
Purchase Details
Closed on
Jan 9, 2008
Sold by
Ballard Marvin C
Bought by
Stanley Sara M
Purchase Details
Closed on
Sep 28, 1990
Sold by
Ballard Marvin C
Bought by
Ballard Marvin C and Mary Davis Balla
Purchase Details
Closed on
Oct 1, 1955
Bought by
Ballard Marvin C
Create a Home Valuation Report for This Property
The Home Valuation Report is an in-depth analysis detailing your home's value as well as a comparison with similar homes in the area
Home Values in the Area
Average Home Value in this Area
Purchase History
| Date | Buyer | Sale Price | Title Company |
|---|---|---|---|
| Feeney Vickie D | $63,800 | -- | |
| Stanley Sara M | -- | -- | |
| Ballard Marvin C | -- | -- | |
| Stanley Sara M | -- | -- | |
| Ballard Marvin C | -- | -- | |
| Ballard Marvin C | -- | -- |
Source: Public Records
Mortgage History
| Date | Status | Borrower | Loan Amount |
|---|---|---|---|
| Open | Feeney Vickie D | $62,814 |
Source: Public Records
Tax History Compared to Growth
Tax History
| Year | Tax Paid | Tax Assessment Tax Assessment Total Assessment is a certain percentage of the fair market value that is determined by local assessors to be the total taxable value of land and additions on the property. | Land | Improvement |
|---|---|---|---|---|
| 2024 | $606 | $16,934 | $3,682 | $13,252 |
| 2023 | $606 | $16,934 | $3,682 | $13,252 |
| 2022 | $516 | $14,184 | $2,832 | $11,352 |
| 2021 | $466 | $12,814 | $2,832 | $9,982 |
| 2020 | $402 | $12,814 | $2,832 | $9,982 |
| 2019 | $410 | $12,814 | $2,832 | $9,982 |
| 2018 | $383 | $11,835 | $2,832 | $9,003 |
| 2017 | $379 | $12,003 | $2,832 | $9,171 |
| 2016 | $386 | $12,003 | $2,832 | $9,171 |
| 2015 | $398 | $12,003 | $2,832 | $9,171 |
| 2014 | $406 | $12,003 | $2,832 | $9,171 |
Source: Public Records
Map
Nearby Homes
- 310 Sunset Dr
- 111 Vineyard Rd
- 1548 Fleetwood Dr
- 130 N Morgan Dr
- 205 Westmoreland Dr
- 2407 Old Atlanta Rd
- 208 Tyler Trace
- 111 Patterson Rd
- 441 Hickory Ln
- 304 Kilgore Rd
- 78 Helen Dr
- 1205 Chardonnay Ln
- 611A Seminole Dr
- 230 Manley Rd
- 313 Sammy Cir
- 813 Vineyard Rd
- 101 Front St
- 1757 Pineview Rd
- 1807 Ridge St
- 339 Main St
- 217 Vineyard Rd
- 215 Vineyard Rd
- 213 Vineyard Rd
- 222 Vineyard Rd
- 220 Vineyard Rd
- 224 Vineyard Rd
- 211 Vineyard Rd
- 304 Vineyard Rd
- 212 Vineyard Rd Unit 23
- 212 Vineyard Rd
- 214 Vineyard Rd
- 306 Vineyard Rd
- 209 Vineyard Rd
- 260 Manley Dr
- 210 Vineyard Rd
- 302 Vineyard Rd
- 300 Vineyard Rd
- 207 Vineyard Rd
- 308 Vineyard Rd
- 258 Manley Dr