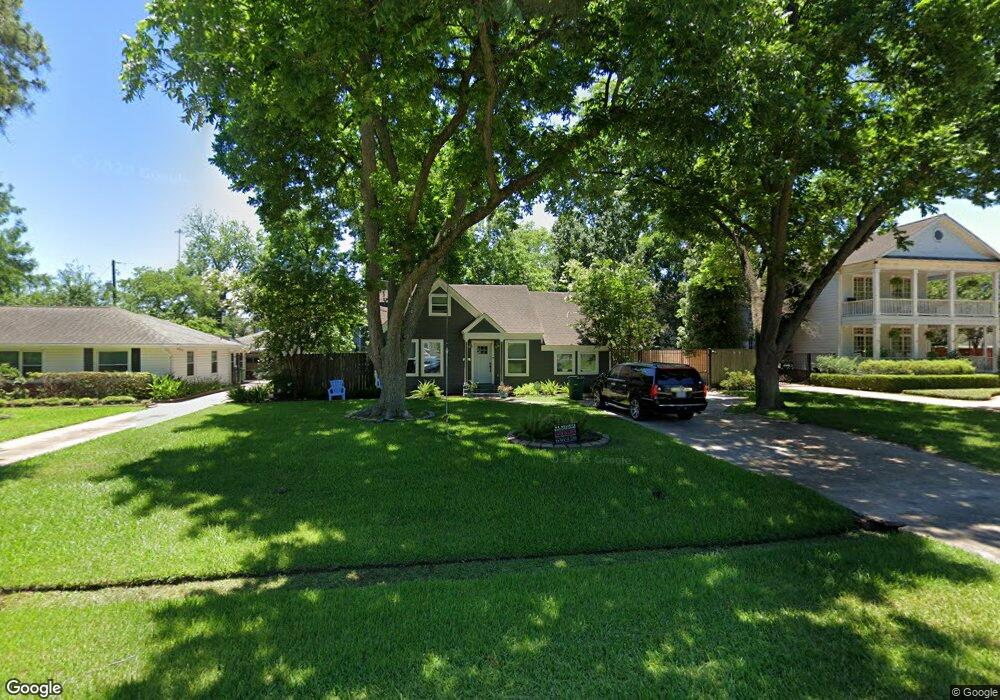
219 W 31st St Houston, TX 77018
Oak Forest-Garden Oaks NeighborhoodEstimated Value: $723,000 - $771,000
3
Beds
2
Baths
1,935
Sq Ft
$386/Sq Ft
Est. Value
About This Home
This home is located at 219 W 31st St, Houston, TX 77018 and is currently estimated at $745,983, approximately $385 per square foot. 219 W 31st St is a home located in Harris County with nearby schools including Garden Oaks Montessori, Frank Black Middle School, and Booker T Washington Sr High.
Ownership History
Date
Name
Owned For
Owner Type
Purchase Details
Closed on
Jun 13, 2013
Sold by
Payne Christopher Brian
Bought by
Taylor Andrew and Taylor Tana M
Current Estimated Value
Home Financials for this Owner
Home Financials are based on the most recent Mortgage that was taken out on this home.
Original Mortgage
$262,400
Outstanding Balance
$185,739
Interest Rate
3.38%
Mortgage Type
New Conventional
Estimated Equity
$560,244
Purchase Details
Closed on
Aug 30, 2007
Sold by
Byle Kenneth A and Byle Erin E
Bought by
Payne Christopher Brian
Home Financials for this Owner
Home Financials are based on the most recent Mortgage that was taken out on this home.
Original Mortgage
$288,000
Interest Rate
6.72%
Mortgage Type
Purchase Money Mortgage
Purchase Details
Closed on
Feb 4, 1999
Sold by
Griffith Billy Richard and Griffith Alta Clark
Bought by
Byle Kenneth A and Byle Erin E
Home Financials for this Owner
Home Financials are based on the most recent Mortgage that was taken out on this home.
Original Mortgage
$110,500
Interest Rate
6.78%
Create a Home Valuation Report for This Property
The Home Valuation Report is an in-depth analysis detailing your home's value as well as a comparison with similar homes in the area
Home Values in the Area
Average Home Value in this Area
Purchase History
| Date | Buyer | Sale Price | Title Company |
|---|---|---|---|
| Taylor Andrew | -- | Chicago Title | |
| Payne Christopher Brian | -- | Charter Title Company | |
| Byle Kenneth A | -- | First American Title |
Source: Public Records
Mortgage History
| Date | Status | Borrower | Loan Amount |
|---|---|---|---|
| Open | Taylor Andrew | $262,400 | |
| Previous Owner | Payne Christopher Brian | $288,000 | |
| Previous Owner | Byle Kenneth A | $110,500 |
Source: Public Records
Tax History Compared to Growth
Tax History
| Year | Tax Paid | Tax Assessment Tax Assessment Total Assessment is a certain percentage of the fair market value that is determined by local assessors to be the total taxable value of land and additions on the property. | Land | Improvement |
|---|---|---|---|---|
| 2025 | $10,967 | $711,035 | $532,560 | $178,475 |
| 2024 | $10,967 | $705,822 | $532,560 | $173,262 |
| 2023 | $10,967 | $694,944 | $507,200 | $187,744 |
| 2022 | $13,570 | $616,270 | $418,440 | $197,830 |
| 2021 | $13,072 | $560,869 | $393,080 | $167,789 |
| 2020 | $12,568 | $519,000 | $393,080 | $125,920 |
| 2019 | $13,740 | $542,972 | $393,080 | $149,892 |
| 2018 | $9,856 | $499,305 | $355,040 | $144,265 |
| 2017 | $12,522 | $495,203 | $355,040 | $140,163 |
| 2016 | $11,881 | $495,203 | $355,040 | $140,163 |
| 2015 | $6,715 | $502,690 | $355,040 | $147,650 |
| 2014 | $6,715 | $333,506 | $253,600 | $79,906 |
Source: Public Records
Map
Nearby Homes
- 131 E 31st 1 2 St
- 207 W 33rd St
- 312 W 32nd St
- 121 E 31st 1 2 St Unit Lots 15,16 & 17
- 111 E 33rd St Unit B
- 201 E 30th St
- 119 E 32nd St Unit A
- 408 W 30th St
- 110 E 28th St
- 239 W 27th St
- 336 W 32nd St
- 326 W 28th St
- 216 E 31st 1/2 St Unit A
- 111 E 32nd St Unit C
- 205 E 28th St
- 202 W 27th St
- 2714 Harvard St
- 0 N North Loop Unit 14609983
- 324 W 27th St
- 2710 Harvard St