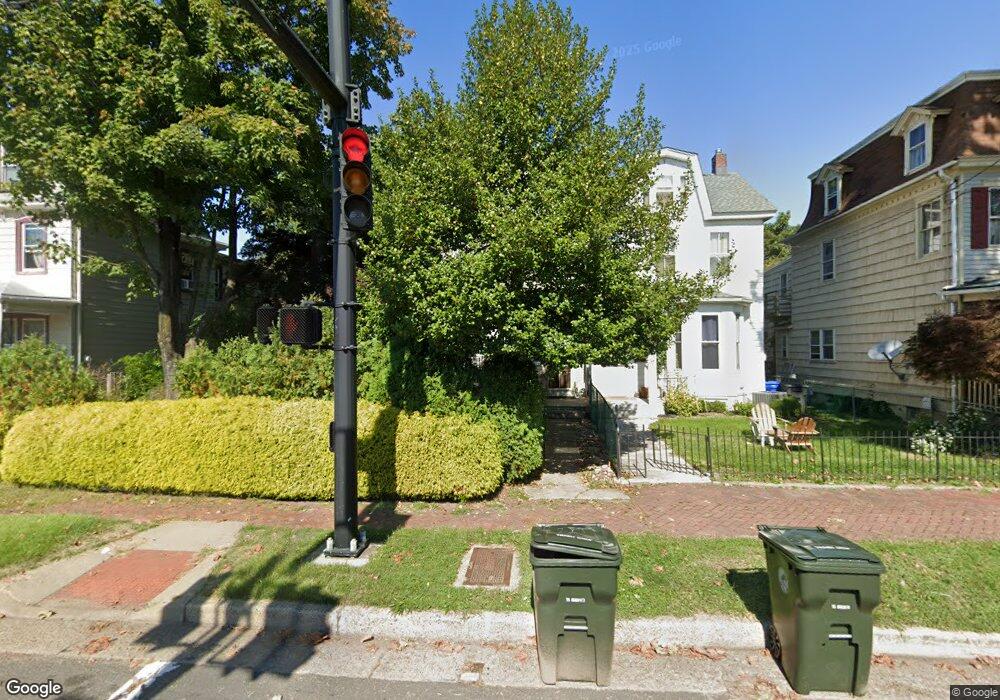
219 W Broad St Burlington, NJ 08016
Estimated Value: $255,000 - $492,808
--
Bed
--
Bath
1,770
Sq Ft
$187/Sq Ft
Est. Value
About This Home
This home is located at 219 W Broad St, Burlington, NJ 08016 and is currently estimated at $331,202, approximately $187 per square foot. 219 W Broad St is a home located in Burlington County with nearby schools including Burlington City High School, Doane Academy, and St Paul's Parochial School.
Ownership History
Date
Name
Owned For
Owner Type
Purchase Details
Closed on
Sep 23, 2010
Sold by
Roberts Jon Michael
Bought by
Roberts Laura L
Current Estimated Value
Purchase Details
Closed on
Aug 25, 1993
Sold by
Goldy Thomas
Bought by
Rader Robert E
Home Financials for this Owner
Home Financials are based on the most recent Mortgage that was taken out on this home.
Original Mortgage
$17,000
Interest Rate
7.21%
Create a Home Valuation Report for This Property
The Home Valuation Report is an in-depth analysis detailing your home's value as well as a comparison with similar homes in the area
Home Values in the Area
Average Home Value in this Area
Purchase History
| Date | Buyer | Sale Price | Title Company |
|---|---|---|---|
| Roberts Laura L | -- | None Available | |
| Rader Robert E | $43,000 | -- |
Source: Public Records
Mortgage History
| Date | Status | Borrower | Loan Amount |
|---|---|---|---|
| Closed | Rader Robert E | $17,000 |
Source: Public Records
Tax History Compared to Growth
Tax History
| Year | Tax Paid | Tax Assessment Tax Assessment Total Assessment is a certain percentage of the fair market value that is determined by local assessors to be the total taxable value of land and additions on the property. | Land | Improvement |
|---|---|---|---|---|
| 2025 | $6,573 | $151,800 | $40,500 | $111,300 |
| 2024 | $6,458 | $151,800 | $40,500 | $111,300 |
| 2023 | $6,458 | $151,800 | $40,500 | $111,300 |
| 2022 | $6,386 | $151,800 | $40,500 | $111,300 |
| 2021 | $6,294 | $151,800 | $40,500 | $111,300 |
| 2020 | $6,069 | $151,800 | $40,500 | $111,300 |
| 2019 | $5,788 | $151,800 | $40,500 | $111,300 |
| 2018 | $5,689 | $151,800 | $40,500 | $111,300 |
| 2017 | $5,515 | $151,800 | $40,500 | $111,300 |
| 2016 | $5,307 | $151,800 | $40,500 | $111,300 |
| 2015 | $5,117 | $151,800 | $40,500 | $111,300 |
| 2014 | $4,949 | $151,800 | $40,500 | $111,300 |
Source: Public Records
Map
Nearby Homes