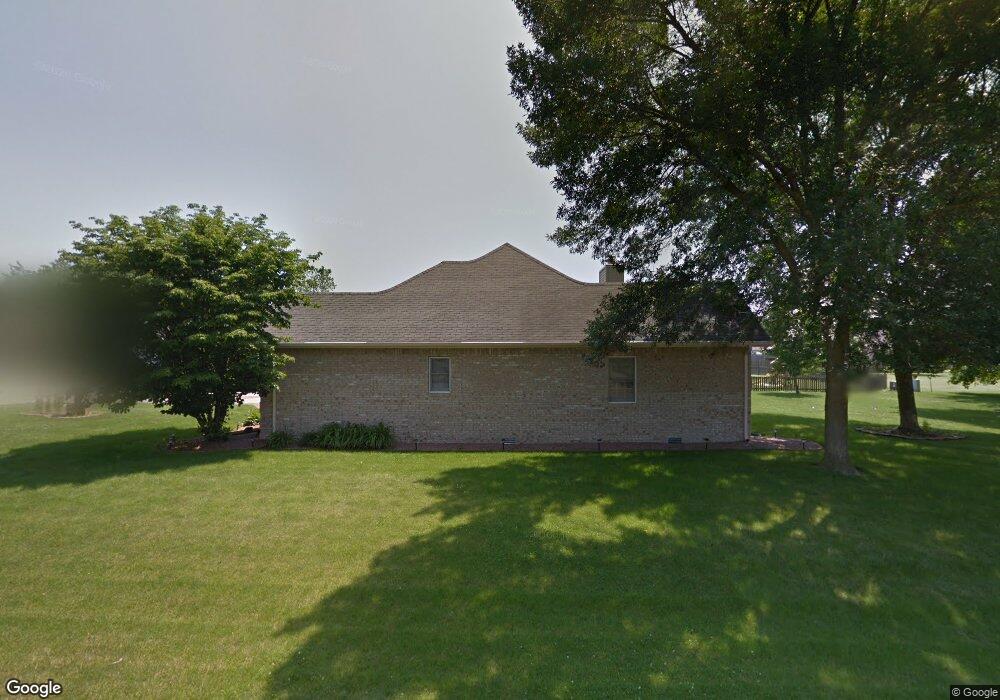
2190 Oakridge Pkwy N Terre Haute, IN 47802
Estimated Value: $235,000 - $258,705
--
Bed
3
Baths
1,418
Sq Ft
$176/Sq Ft
Est. Value
About This Home
This home is located at 2190 Oakridge Pkwy N, Terre Haute, IN 47802 and is currently estimated at $249,426, approximately $175 per square foot. 2190 Oakridge Pkwy N is a home located in Vigo County with nearby schools including Hoosier Prairie Elementary School, Honey Creek Middle School, and Terre Haute South Vigo High School.
Ownership History
Date
Name
Owned For
Owner Type
Purchase Details
Closed on
Oct 31, 2012
Sold by
Stone Financing Llc
Bought by
Dobson Ann J
Current Estimated Value
Home Financials for this Owner
Home Financials are based on the most recent Mortgage that was taken out on this home.
Original Mortgage
$41,000
Outstanding Balance
$7,278
Interest Rate
3.38%
Mortgage Type
New Conventional
Estimated Equity
$242,148
Purchase Details
Closed on
Oct 30, 2012
Sold by
Kessel Eric T and Kessel Lindsay J
Bought by
Stone Financing Llc
Home Financials for this Owner
Home Financials are based on the most recent Mortgage that was taken out on this home.
Original Mortgage
$41,000
Outstanding Balance
$7,278
Interest Rate
3.38%
Mortgage Type
New Conventional
Estimated Equity
$242,148
Purchase Details
Closed on
Jun 11, 2009
Sold by
Fleck Paul E
Bought by
Kessel Eric T and Kessel Lindsay J
Home Financials for this Owner
Home Financials are based on the most recent Mortgage that was taken out on this home.
Original Mortgage
$132,456
Interest Rate
4.83%
Mortgage Type
FHA
Create a Home Valuation Report for This Property
The Home Valuation Report is an in-depth analysis detailing your home's value as well as a comparison with similar homes in the area
Home Values in the Area
Average Home Value in this Area
Purchase History
| Date | Buyer | Sale Price | Title Company |
|---|---|---|---|
| Dobson Ann J | -- | Security Title Services Llc | |
| Stone Financing Llc | -- | None Available | |
| Kessel Eric T | -- | -- |
Source: Public Records
Mortgage History
| Date | Status | Borrower | Loan Amount |
|---|---|---|---|
| Open | Dobson Ann J | $41,000 | |
| Previous Owner | Kessel Eric T | $132,456 |
Source: Public Records
Tax History Compared to Growth
Tax History
| Year | Tax Paid | Tax Assessment Tax Assessment Total Assessment is a certain percentage of the fair market value that is determined by local assessors to be the total taxable value of land and additions on the property. | Land | Improvement |
|---|---|---|---|---|
| 2024 | $2,140 | $198,700 | $55,600 | $143,100 |
| 2023 | $2,124 | $194,700 | $55,600 | $139,100 |
| 2022 | $1,916 | $179,100 | $55,600 | $123,500 |
| 2021 | $1,790 | $168,000 | $54,500 | $113,500 |
| 2020 | $1,772 | $166,500 | $54,000 | $112,500 |
| 2019 | $1,723 | $163,600 | $53,000 | $110,600 |
| 2018 | $2,310 | $161,800 | $51,500 | $110,300 |
| 2017 | $1,427 | $147,900 | $39,500 | $108,400 |
| 2016 | $1,377 | $145,100 | $38,700 | $106,400 |
| 2014 | $1,254 | $140,100 | $37,100 | $103,000 |
| 2013 | $1,254 | $139,200 | $36,800 | $102,400 |
Source: Public Records
Map
Nearby Homes
- Lot 4 W Curry Dr
- 1624 W Sitting Bull Dr
- 2148 W Kennett Dr
- 8120 S Cullen Place
- 625 W Rigney Dr
- Lot 5 Meadow Ridge Rd
- 3890 Florence Ct
- 3919 W Wahachee Dr
- 1 W Rigney Dr
- 1519 S 17th
- 4436 S Longyear Place
- 6869 E Manor Dr
- 651 E Curry Dr
- 6727 E Manor Dr
- 4416 S Alan Place
- 7401 S Pine Hill St
- 7297 S Pine Hill St
- 7435 S Ellenwood St
- 9777 S Armstrong Place
- 7975 Marblehead Ct
- 2168 Oakridge Pkwy N
- 2168 Oakridge Pkwy N
- 2225 Oakridge Pkwy
- 2189 Oakridge Pkwy S
- 2191 Oakridge Pkwy N
- 2146 Oakridge Pkwy N
- 2167 Oakridge Pkwy S
- 2169 Oakridge Pkwy N
- 2224 Oakridge Pkwy
- 2211 Oakridge Pkwy N
- 2145 Oakridge Pkwy S
- 6700 S State Road 63
- 2147 Oakridge Pkwy N
- 2124 Oakridge Pkwy N
- 2123 Oakridge Pkwy S
- 2125 Oakridge Pkwy N
- 2188 Oakridge Pkwy S
- 2166 Oakridge Pkwy S
- 2102 Oakridge Pkwy N
- 2200 Oakridge Pkwy S