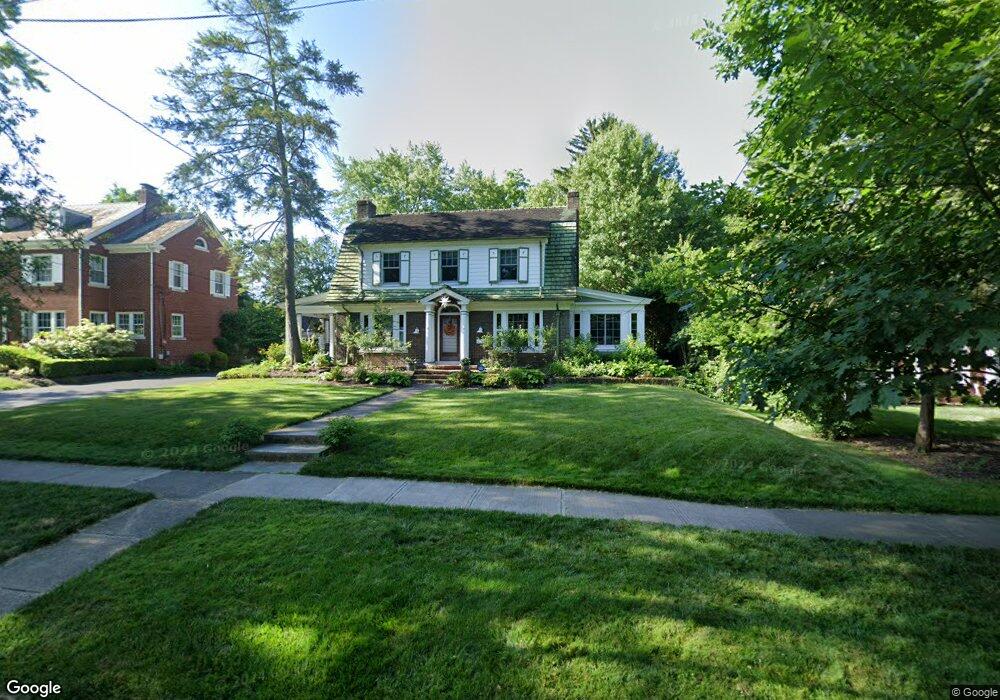
2191 Bryden Rd Columbus, OH 43209
Estimated Value: $702,829 - $833,000
3
Beds
2
Baths
1,950
Sq Ft
$398/Sq Ft
Est. Value
About This Home
This home is located at 2191 Bryden Rd, Columbus, OH 43209 and is currently estimated at $775,207, approximately $397 per square foot. 2191 Bryden Rd is a home located in Franklin County with nearby schools including Cassingham Elementary School, Bexley Middle School, and Bexley High School.
Ownership History
Date
Name
Owned For
Owner Type
Purchase Details
Closed on
Jun 14, 2022
Sold by
Dietz Susyn L and Dietz David J
Bought by
Kauffman Carol Ann and Malone John Daniel
Current Estimated Value
Home Financials for this Owner
Home Financials are based on the most recent Mortgage that was taken out on this home.
Original Mortgage
$520,000
Interest Rate
5.27%
Mortgage Type
New Conventional
Purchase Details
Closed on
May 28, 2004
Sold by
Pflaumer Karen L and Oscar E Kaiser Trust
Bought by
Dietz Susyn L and Dietz David J
Home Financials for this Owner
Home Financials are based on the most recent Mortgage that was taken out on this home.
Original Mortgage
$263,200
Interest Rate
6.17%
Mortgage Type
Purchase Money Mortgage
Purchase Details
Closed on
Dec 15, 1983
Bought by
Pflaumer Karen L Tr
Create a Home Valuation Report for This Property
The Home Valuation Report is an in-depth analysis detailing your home's value as well as a comparison with similar homes in the area
Home Values in the Area
Average Home Value in this Area
Purchase History
| Date | Buyer | Sale Price | Title Company |
|---|---|---|---|
| Kauffman Carol Ann | $650,000 | Northwest Title | |
| Dietz Susyn L | $329,000 | Title First | |
| Pflaumer Karen L Tr | -- | -- |
Source: Public Records
Mortgage History
| Date | Status | Borrower | Loan Amount |
|---|---|---|---|
| Previous Owner | Kauffman Carol Ann | $520,000 | |
| Previous Owner | Dietz Susyn L | $263,200 |
Source: Public Records
Tax History Compared to Growth
Tax History
| Year | Tax Paid | Tax Assessment Tax Assessment Total Assessment is a certain percentage of the fair market value that is determined by local assessors to be the total taxable value of land and additions on the property. | Land | Improvement |
|---|---|---|---|---|
| 2024 | $11,848 | $213,360 | $103,600 | $109,760 |
| 2023 | $10,653 | $213,360 | $103,600 | $109,760 |
| 2022 | $9,280 | $149,280 | $60,480 | $88,800 |
| 2021 | $9,288 | $149,280 | $60,480 | $88,800 |
| 2020 | $9,206 | $149,280 | $60,480 | $88,800 |
| 2019 | $9,524 | $135,880 | $54,990 | $80,890 |
| 2018 | $8,355 | $135,880 | $54,990 | $80,890 |
| 2017 | $8,076 | $135,880 | $54,990 | $80,890 |
| 2016 | $8,410 | $129,290 | $55,370 | $73,920 |
| 2015 | $8,434 | $129,290 | $55,370 | $73,920 |
| 2014 | $8,482 | $129,290 | $55,370 | $73,920 |
| 2013 | $4,008 | $117,530 | $50,330 | $67,200 |
Source: Public Records
Map
Nearby Homes
- 419 Westland Ave
- 2350 Bryden Rd
- 1000 S Dawson Ave Unit 302
- 2417 Fair Ave
- 211 Preston Rd
- 1825-1827 Bryden Rd
- 1833 Franklin Ave
- 866-868 Sheridan Ave
- 572 Bulen Ave
- 1779 E Main St
- 1800 E Fulton St
- 57 Preston Rd
- 1747 E Mound St
- 849 Lyman Ave
- 395-397 Stoddart Ave
- 696 Vernon Rd
- 1692 Bryden Rd
- 1714 Oak St
- 751 Bulen Ave
- 891 Vernon Rd
- 2177 Bryden Rd
- 2173 Bryden Rd
- 485 Columbia Place
- 475 Columbia Place
- 495 Columbia Place
- 2188 Bryden Rd
- 517 S Columbia Ave
- 587 S Columbia Ave
- 2202 Bryden Rd
- 2180 Bryden Rd
- 470 S Parkview Ave
- 2206 Bryden Rd
- 464 S Parkview Ave
- 474 S Parkview Ave
- 505 Columbia Place
- 2170 Bryden Rd
- 486 S Parkview Ave
- 480 Columbia Place
- 500 Columbia Place
- 4357 Olentangy Place