Estimated Value: $192,000 - $214,000
3
Beds
2
Baths
1,328
Sq Ft
$150/Sq Ft
Est. Value
About This Home
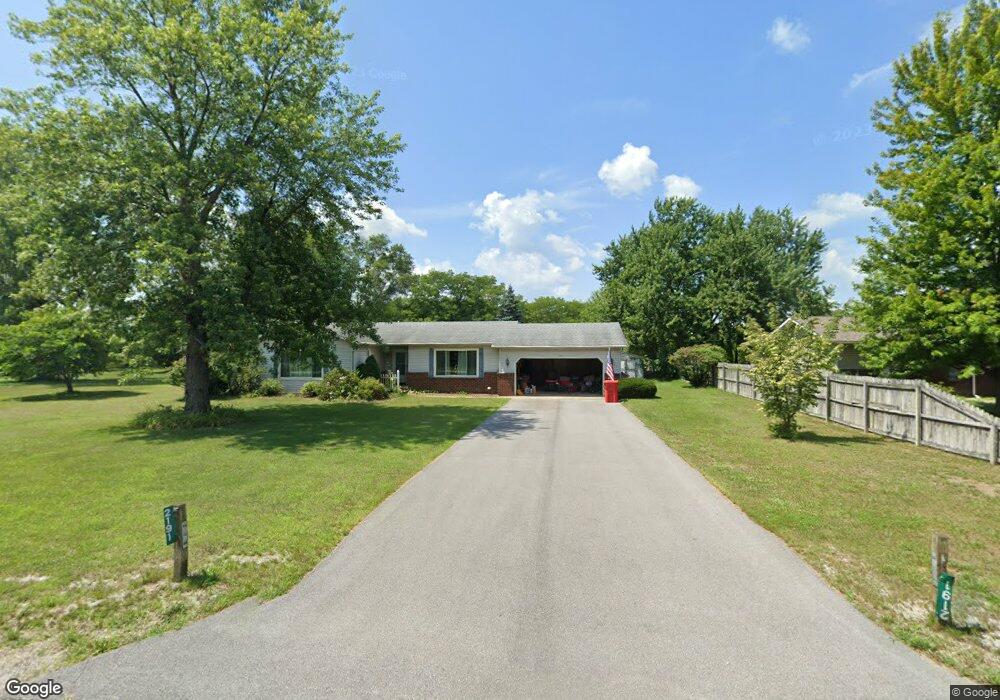
This home is located at 2191 N 325 E, Knox, IN 46534 and is currently estimated at $199,269, approximately $150 per square foot. 2191 N 325 E is a home located in Starke County with nearby schools including Knox Community Elementary School, Knox Community Middle School, and Knox Community High School.
Ownership History
Date
Name
Owned For
Owner Type
Purchase Details
Closed on
Jun 29, 2005
Sold by
Bogovich Mark S
Bought by
Embry Brian W and Embry Penny S
Current Estimated Value
Home Financials for this Owner
Home Financials are based on the most recent Mortgage that was taken out on this home.
Original Mortgage
$97,900
Outstanding Balance
$49,565
Interest Rate
5.69%
Mortgage Type
New Conventional
Estimated Equity
$149,704
Purchase Details
Closed on
Oct 23, 2001
Sold by
Mark Lovins
Bought by
Bogovich Mark S
Purchase Details
Closed on
Apr 30, 2001
Sold by
Charles Lovins
Bought by
Lovins Mark
Create a Home Valuation Report for This Property
The Home Valuation Report is an in-depth analysis detailing your home's value as well as a comparison with similar homes in the area
Purchase History
| Date | Buyer | Sale Price | Title Company |
|---|---|---|---|
| Embry Brian W | -- | None Available | |
| Bogovich Mark S | $79,500 | -- | |
| Lovins Mark | -- | -- |
Source: Public Records
Mortgage History
| Date | Status | Borrower | Loan Amount |
|---|---|---|---|
| Open | Embry Brian W | $97,900 |
Source: Public Records
Tax History
| Year | Tax Paid | Tax Assessment Tax Assessment Total Assessment is a certain percentage of the fair market value that is determined by local assessors to be the total taxable value of land and additions on the property. | Land | Improvement |
|---|---|---|---|---|
| 2025 | $1,116 | $174,300 | $18,700 | $155,600 |
| 2024 | $1,116 | $158,600 | $17,900 | $140,700 |
| 2023 | $1,091 | $142,400 | $16,300 | $126,100 |
| 2022 | $768 | $127,400 | $15,000 | $112,400 |
| 2021 | $649 | $108,700 | $15,000 | $93,700 |
| 2020 | $863 | $97,200 | $15,000 | $82,200 |
| 2019 | $792 | $91,500 | $15,000 | $76,500 |
| 2018 | $634 | $89,500 | $15,600 | $73,900 |
| 2017 | $601 | $88,200 | $15,600 | $72,600 |
| 2016 | $607 | $87,100 | $15,600 | $71,500 |
| 2014 | $435 | $88,600 | $16,300 | $72,300 |
| 2013 | $413 | $88,000 | $16,300 | $71,700 |
Source: Public Records
Map
Nearby Homes
- 4500 E 300 N
- 4170 E 250 N
- 100 N Portland St
- 207 W Lake St
- 203 W Lake St
- V/L E 100 N
- 551 E Mound St
- 2 N Pearl St
- 303 E Lake St
- 105 S Bower St
- 810 E Washington St
- 305 W New York St
- 302 S Main St
- 10300 E 150 N
- 154 W New York St
- 1103 E Lake St
- 4152 S State Road 35
- 156 W Street Louis St
- 1675 U S 35
- 601 S Heaton St
Your Personal Tour Guide
Ask me questions while you tour the home.