Estimated Value: $386,000 - $416,000
5
Beds
2
Baths
1,947
Sq Ft
$208/Sq Ft
Est. Value
About This Home
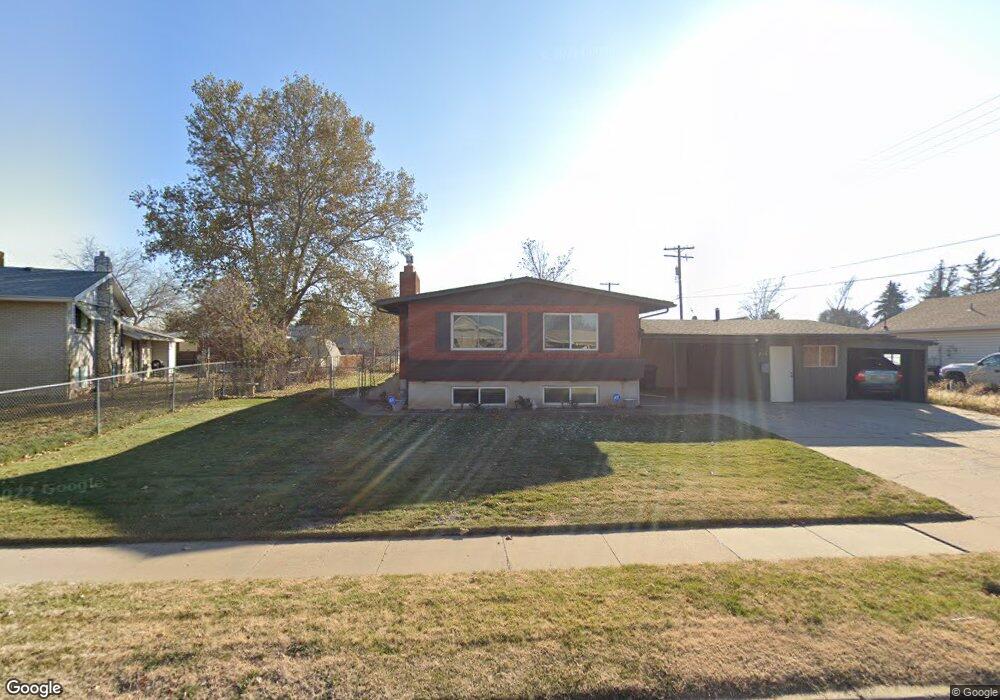
This home is located at 2191 W 4350 S, Roy, UT 84067 and is currently estimated at $405,013, approximately $208 per square foot. 2191 W 4350 S is a home located in Weber County with nearby schools including North Park School, Sand Ridge Junior High School, and Roy High School.
Ownership History
Date
Name
Owned For
Owner Type
Purchase Details
Closed on
Sep 24, 1998
Sold by
Va
Bought by
Nunnikhoven Russell L and Nunnikhoven Candi
Current Estimated Value
Home Financials for this Owner
Home Financials are based on the most recent Mortgage that was taken out on this home.
Original Mortgage
$111,180
Outstanding Balance
$23,708
Interest Rate
6.88%
Mortgage Type
VA
Estimated Equity
$381,305
Purchase Details
Closed on
Dec 18, 1997
Sold by
Ketcham Timothy J and Ketcham Donna J
Bought by
Principal Residential Mtg Inc
Purchase Details
Closed on
Aug 2, 1996
Sold by
Neilson Robert and Neilson Leah
Bought by
Ketcham Timothy J and Ketcham Donna J
Home Financials for this Owner
Home Financials are based on the most recent Mortgage that was taken out on this home.
Original Mortgage
$112,200
Interest Rate
8.32%
Mortgage Type
VA
Create a Home Valuation Report for This Property
The Home Valuation Report is an in-depth analysis detailing your home's value as well as a comparison with similar homes in the area
Home Values in the Area
Average Home Value in this Area
Purchase History
| Date | Buyer | Sale Price | Title Company |
|---|---|---|---|
| Nunnikhoven Russell L | -- | Mountain View Title | |
| Principal Residential Mtg Inc | $91,863 | Backman Stewart Title | |
| Ketcham Timothy J | -- | Bonneville Title |
Source: Public Records
Mortgage History
| Date | Status | Borrower | Loan Amount |
|---|---|---|---|
| Open | Nunnikhoven Russell L | $111,180 | |
| Previous Owner | Ketcham Timothy J | $112,200 |
Source: Public Records
Tax History Compared to Growth
Tax History
| Year | Tax Paid | Tax Assessment Tax Assessment Total Assessment is a certain percentage of the fair market value that is determined by local assessors to be the total taxable value of land and additions on the property. | Land | Improvement |
|---|---|---|---|---|
| 2025 | $2,467 | $388,410 | $125,000 | $263,410 |
| 2024 | $2,409 | $210,099 | $68,758 | $141,341 |
| 2023 | $2,290 | $199,650 | $63,153 | $136,497 |
| 2022 | $2,286 | $205,150 | $55,002 | $150,148 |
| 2021 | $1,835 | $269,000 | $69,994 | $199,006 |
| 2020 | $1,683 | $226,000 | $69,994 | $156,006 |
| 2019 | $1,575 | $198,000 | $40,554 | $157,446 |
| 2018 | $1,441 | $169,000 | $37,527 | $131,473 |
| 2017 | $1,431 | $158,000 | $37,527 | $120,473 |
| 2016 | $1,288 | $75,525 | $17,909 | $57,616 |
| 2015 | $1,123 | $66,337 | $17,909 | $48,428 |
| 2014 | $1,100 | $64,113 | $17,909 | $46,204 |
Source: Public Records
Map
Nearby Homes
- 2263 W 4400 S
- 4328 S 2175 W
- 2082 W 4450 S
- 2259 W 4525 S
- 4475 S 1975 W
- 4220 S 2075 W
- 2015 W 4225 S
- 4205 S 2075 W
- 2038 W 4600 S
- 4164 S 2400 W
- 4110 S 2275 W
- 4073 S 2175 W
- 4536 S 1900 W Unit 12
- 4642 S 1900 W Unit 41
- 1825 W 4400 S
- 1825 W 4500 S Unit 101
- 2067 W 4750 S
- 2642 W 4400 S
- 2070 W 4000 S
- 2050 W 4000 S