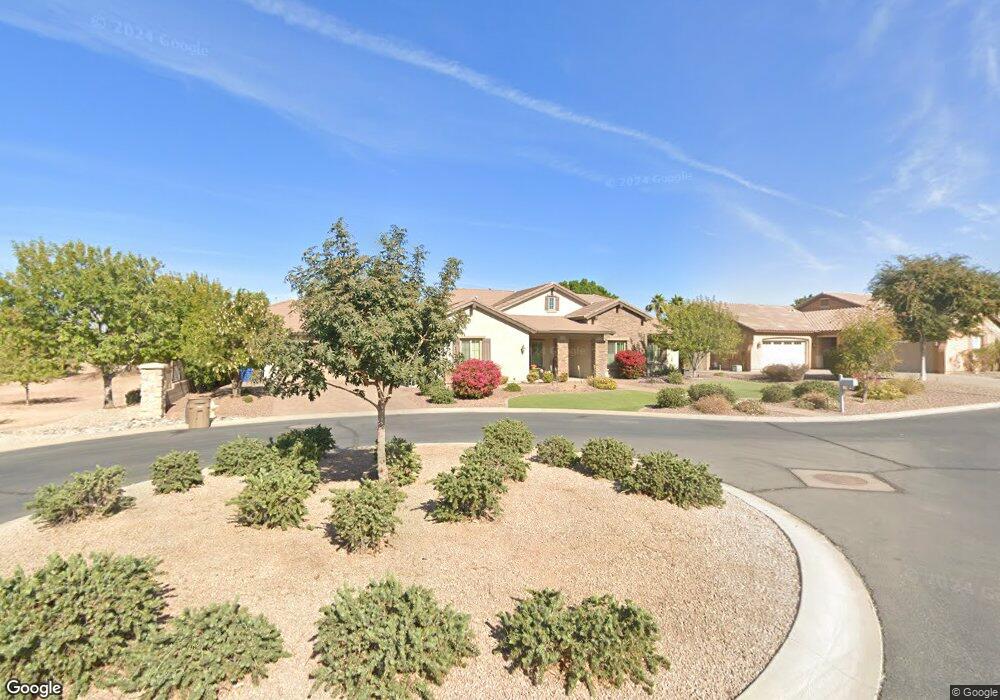
21916 E Duncan Ct Queen Creek, AZ 85142
Estimated Value: $958,022 - $1,049,000
--
Bed
1
Bath
4,112
Sq Ft
$244/Sq Ft
Est. Value
About This Home
This home is located at 21916 E Duncan Ct, Queen Creek, AZ 85142 and is currently estimated at $1,003,506, approximately $244 per square foot. 21916 E Duncan Ct is a home with nearby schools including Faith Mather Sossaman Elementary School, Queen Creek Junior High School, and Benjamin Franklin Charter School - Crismon.
Ownership History
Date
Name
Owned For
Owner Type
Purchase Details
Closed on
Aug 3, 2012
Sold by
Fulton Homes Sales Corporation
Bought by
Benson Christopher T and Benson Shauna
Current Estimated Value
Home Financials for this Owner
Home Financials are based on the most recent Mortgage that was taken out on this home.
Original Mortgage
$334,280
Outstanding Balance
$231,028
Interest Rate
3.62%
Mortgage Type
New Conventional
Estimated Equity
$772,478
Purchase Details
Closed on
Feb 6, 2012
Sold by
220Th Street Properties Llc
Bought by
Ash Creek Lots Llc
Home Financials for this Owner
Home Financials are based on the most recent Mortgage that was taken out on this home.
Original Mortgage
$45,000
Interest Rate
3.9%
Mortgage Type
Seller Take Back
Create a Home Valuation Report for This Property
The Home Valuation Report is an in-depth analysis detailing your home's value as well as a comparison with similar homes in the area
Home Values in the Area
Average Home Value in this Area
Purchase History
| Date | Buyer | Sale Price | Title Company |
|---|---|---|---|
| Benson Christopher T | $417,953 | First American Title Ins Co | |
| Fulton Homes Sales Corporation | $358,217 | First American Title Ins Co | |
| Fulton Homes Corporation | -- | First American Title Ins Co | |
| Ash Creek Lots Llc | $65,000 | First American Title |
Source: Public Records
Mortgage History
| Date | Status | Borrower | Loan Amount |
|---|---|---|---|
| Open | Benson Christopher T | $334,280 | |
| Previous Owner | Ash Creek Lots Llc | $45,000 |
Source: Public Records
Tax History Compared to Growth
Tax History
| Year | Tax Paid | Tax Assessment Tax Assessment Total Assessment is a certain percentage of the fair market value that is determined by local assessors to be the total taxable value of land and additions on the property. | Land | Improvement |
|---|---|---|---|---|
| 2025 | $5,030 | $49,656 | -- | -- |
| 2024 | $5,083 | $47,291 | -- | -- |
| 2023 | $5,083 | $70,560 | $14,110 | $56,450 |
| 2022 | $4,994 | $53,770 | $10,750 | $43,020 |
| 2021 | $5,104 | $51,720 | $10,340 | $41,380 |
| 2020 | $4,891 | $49,960 | $9,990 | $39,970 |
| 2019 | $4,725 | $48,210 | $9,640 | $38,570 |
| 2018 | $4,539 | $45,460 | $9,090 | $36,370 |
| 2017 | $4,337 | $44,200 | $8,840 | $35,360 |
| 2016 | $4,207 | $42,170 | $8,430 | $33,740 |
| 2015 | $3,441 | $39,930 | $7,980 | $31,950 |
Source: Public Records
Map
Nearby Homes
- 21930 E Tierra Grande Ct
- 21995 E Tierra Grande Ct
- 22617 E Roundup Way
- 22634 E Roundup Way
- 22609 E Roundup Way
- 21752 E Domingo Rd
- 21720 E Domingo Rd
- 22131 E Estrella Rd
- 21778 E Escalante Rd
- 21913 S 215th Way
- 21959 E Desert Hills Dr
- 21433 E Ocotillo Rd
- 22282 E Pickett Ct
- 21911 S 215th St
- 21782 S 222nd Way
- 21665 S 215th Place
- 21938 S 215th St
- 22609 S 214th Way
- 21968 E Camacho Rd
- 22141 E Russet Rd
- 21932 E Duncan Ct
- 21917 E Pickett Ct
- 21933 E Pickett Ct
- 21915 E Duncan Ct
- 21931 E Duncan Ct
- 21948 E Duncan Ct
- 21949 E Pickett Ct
- 21947 E Duncan Ct
- 21934 E Pickett Ct
- 21965 E Pickett Ct
- 21964 E Duncan Ct
- 21950 E Pickett Ct
- 21914 E Munoz Ct
- 21930 E Munoz Ct
- 21963 E Duncan Ct
- 21966 E Pickett Ct
- 21946 E Munoz Ct
- 21980 E Duncan Ct
- 21981 E Pickett Ct
- 21962 E Munoz Ct