
Seller's Agent in 2026
Joni Becerra
Haven Realty
(706) 975-2842
202 Total Sales
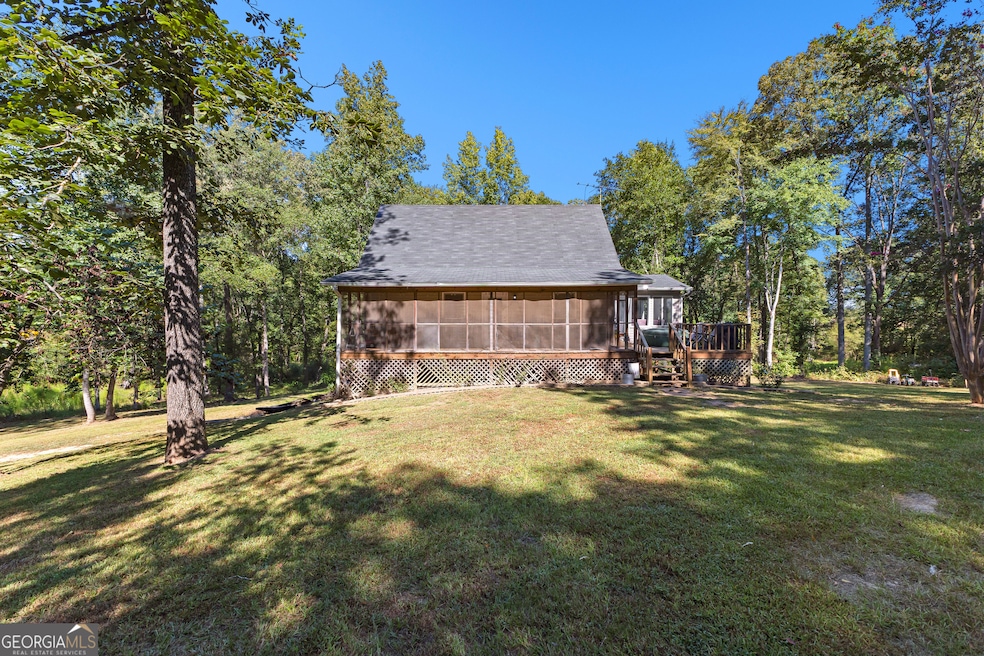
If your soul has been longing for a woodland retreat, look no further. Tucked away on 35 enchanting acres of hardwoods with a winding creek, this 3-bed, 2-bath home is a place where nature takes center stage. Imagine mornings with deer grazing just beyond the porch, afternoons filled with birdsong drifting through the trees, and evenings under a canopy of stars. The master suite on the main level provides a peaceful sanctuary, while two additional bedrooms upstairs welcome family and friends. The heart of the home is the open kitchen and living room, anchored by a cozy fireplace and filled with natural light and serene views of the forest beyond. Step outside to a screened-in porch and lounging deck, perfect for morning coffee or a sunset glass of sweet tea while listening to the sounds of nature. A partial basement with interior and exterior access adds versatility, and a charming chicken coop completes the picture of simple Southern living. This is more than a home-it's a retreat. A place where woods, wildlife, and warm memories are waiting to be made.
| Date | Type | Sale Price | Title Company |
|---|---|---|---|
| Warranty Deed | $275,000 | -- | |
| Deed | -- | -- | |
| Quit Claim Deed | -- | -- | |
| Quit Claim Deed | -- | -- | |
| Deed | -- | -- | |
| Deed | $135,000 | -- | |
| Deed | -- | -- | |
| Deed | -- | -- |
| Date | Status | Loan Amount | Loan Type |
|---|---|---|---|
| Open | $236,568 | New Conventional |
| Date | Event | Price | List to Sale | Price per Sq Ft |
|---|---|---|---|---|
| 02/13/2026 02/13/26 | Sold | $430,000 | -4.4% | $373 / Sq Ft |
| 11/15/2025 11/15/25 | Price Changed | $449,900 | -5.3% | $391 / Sq Ft |
| 10/29/2025 10/29/25 | Price Changed | $474,900 | -2.3% | $412 / Sq Ft |
| 09/11/2025 09/11/25 | For Sale | $485,900 | -- | $422 / Sq Ft |
| Year | Tax Paid | Tax Assessment Tax Assessment Total Assessment is a certain percentage of the fair market value that is determined by local assessors to be the total taxable value of land and additions on the property. | Land | Improvement |
|---|---|---|---|---|
| 2025 | $2,046 | $138,085 | $61,717 | $76,368 |
| 2024 | $2,006 | $136,784 | $66,938 | $69,846 |
| 2023 | $2,341 | $136,784 | $66,938 | $69,846 |
| 2022 | $1,525 | $94,365 | $51,491 | $42,874 |
| 2021 | $1,659 | $112,079 | $69,205 | $42,874 |
| 2020 | $1,329 | $112,079 | $69,205 | $42,874 |
| 2019 | $1,433 | $70,729 | $37,408 | $33,321 |
| 2018 | $1,426 | $70,729 | $37,408 | $33,321 |
| 2017 | $1,407 | $70,729 | $37,408 | $33,321 |
| 2016 | $1,299 | $70,729 | $37,408 | $33,321 |
| 2015 | $1,052 | $66,903 | $37,408 | $29,495 |
| 2014 | -- | $66,903 | $37,408 | $29,495 |
| 2013 | -- | $66,903 | $37,408 | $29,495 |
Seller's Agent in 2026
Joni Becerra
Haven Realty
(706) 975-2842
202 Total Sales
Buyer's Agent in 2026
Debra Moses
Southern Classic Realtors
(678) 850-0872
113 Total Sales
Source: Georgia MLS
MLS Number: 10602647
APN: 011-003-E
Disclaimer: Certain information contained herein is derived from information provided by parties other than Homes.com. All information provided is deemed reliable, but is not guaranteed to be accurate and should be independently verified.
![]() The data relating to real estate for sale on this web site comes in part from the Broker Reciprocity Program of Georgia MLS. Real estate listings held by brokerage firms other than Redfin are marked with the Broker Reciprocity logo and detailed information about them includes the name of the listing brokers. Information deemed reliable but not guaranteed. Copyright 2026 Georgia MLS. All rights reserved.
The data relating to real estate for sale on this web site comes in part from the Broker Reciprocity Program of Georgia MLS. Real estate listings held by brokerage firms other than Redfin are marked with the Broker Reciprocity logo and detailed information about them includes the name of the listing brokers. Information deemed reliable but not guaranteed. Copyright 2026 Georgia MLS. All rights reserved.
Ask me questions while you tour the home.