2192 Plemmons Rd Appling, GA 30802
Estimated Value: $452,000 - $633,456
3
Beds
2
Baths
2,638
Sq Ft
$207/Sq Ft
Est. Value
About This Home
This home is located at 2192 Plemmons Rd, Appling, GA 30802 and is currently estimated at $545,614, approximately $206 per square foot. 2192 Plemmons Rd is a home located in Columbia County with nearby schools including North Columbia Elementary School, Harlem Middle School, and Harlem High School.
Create a Home Valuation Report for This Property
The Home Valuation Report is an in-depth analysis detailing your home's value as well as a comparison with similar homes in the area
Home Values in the Area
Average Home Value in this Area
Tax History Compared to Growth
Tax History
| Year | Tax Paid | Tax Assessment Tax Assessment Total Assessment is a certain percentage of the fair market value that is determined by local assessors to be the total taxable value of land and additions on the property. | Land | Improvement |
|---|---|---|---|---|
| 2025 | $6,362 | $268,859 | $111,103 | $157,756 |
| 2024 | $5,328 | $215,334 | $82,115 | $133,219 |
| 2023 | $5,328 | $184,782 | $60,124 | $124,658 |
| 2022 | $4,414 | $171,926 | $50,128 | $121,798 |
| 2021 | $4,159 | $155,006 | $50,128 | $104,878 |
| 2020 | $4,041 | $147,584 | $43,307 | $104,277 |
| 2019 | $3,956 | $144,507 | $43,307 | $101,200 |
| 2018 | $3,873 | $141,031 | $43,307 | $97,724 |
| 2017 | $2,778 | $101,356 | $4,186 | $97,170 |
| 2016 | $2,442 | $92,633 | $3,089 | $89,544 |
| 2015 | $2,408 | $91,219 | $3,031 | $88,188 |
| 2014 | $2,349 | $87,944 | $2,974 | $84,970 |
Source: Public Records
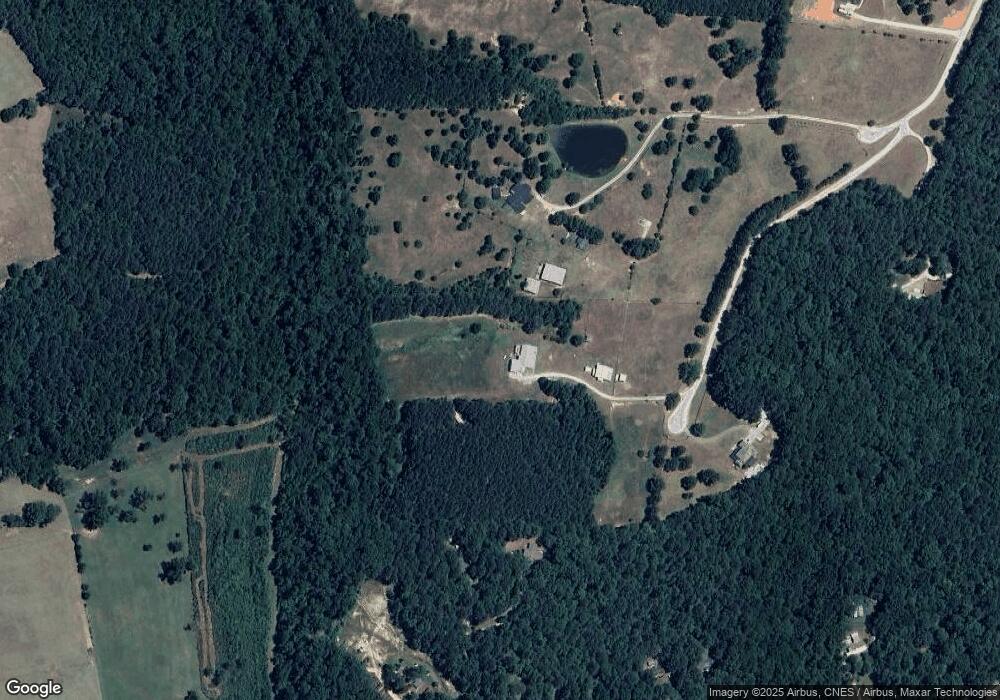
Map
Nearby Homes
- 1171 Meandering Trail
- 7115 Exley Ln
- 1123 Meandering Trail
- 4052 Highfield Dr
- 1129 Meandering Trail
- 1153 Meandering Trail
- 1147 Meandering Trail
- 307 Alabaster Ct
- 3256 Ray Owens Rd
- 1229 Yost Dr
- 2526 Scotts Ferry Rd
- 6662 Shucraft Rd
- 1633 Old Appling Harlem Hwy
- 1631 Swint Rd
- 2362 Pine Ridge Dr
- 1571 Powell Church Rd
- 1584 Swint Rd
- 1518 Swint Rd
- 1590 Swint Rd
- 1566 Swint Rd
- 2194 Plemmons Rd
- 2187 Plemmons Rd
- 375 Annie Laurie Dr
- 355 Annie Laurie Dr
- 363 Annie Laurie Dr
- 2191 Plemmons Rd
- 337 Annie Laurie Dr
- 383 Annie Laurie Dr
- 364 Annie Laurie Dr
- 356 Annie Laurie Dr
- 362 Annie Laurie Dr
- 372 Annie Laurie Dr
- 325 Annie Laurie Dr
- 390 Annie Laurie Dr
- 376 Annie Laurie Dr
- 323 Annie Laurie Dr
- 350 Annie Laurie Dr
- 321 Annie Laurie Dr
- 384 Annie Laurie Dr
- 319 Annie Laurie Dr