Estimated Value: $78,849 - $111,000
2
Beds
1
Bath
912
Sq Ft
$99/Sq Ft
Est. Value
About This Home
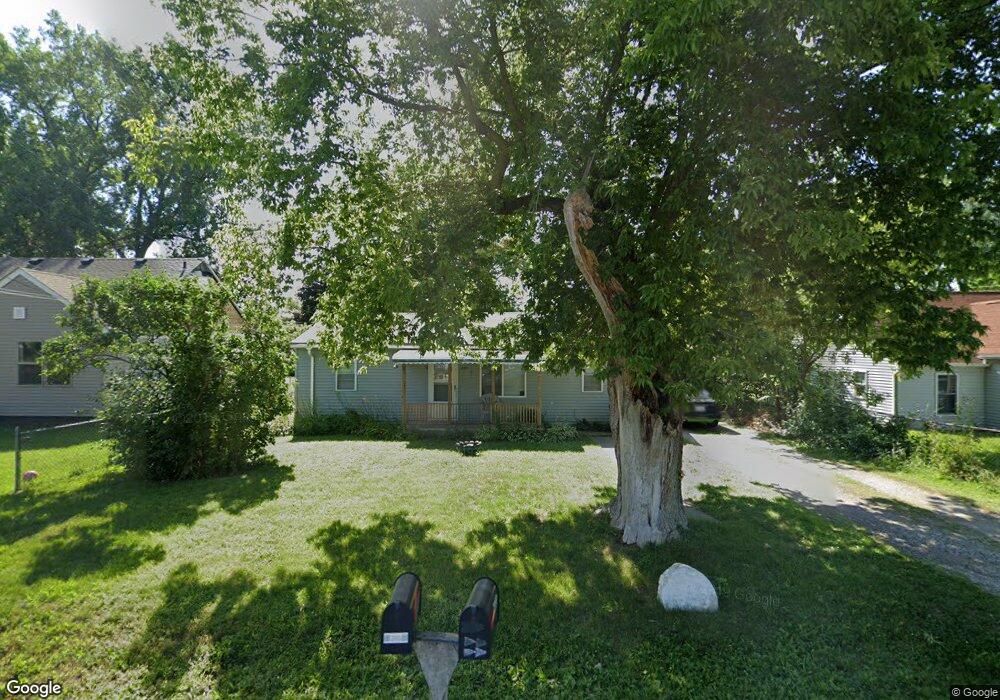
This home is located at 2192 S Graham Rd, Flint, MI 48532 and is currently estimated at $89,962, approximately $98 per square foot. 2192 S Graham Rd is a home located in Genesee County with nearby schools including Carman-Ainsworth High School, Genesee STEM Academy, and St. Paul Lutheran School.
Ownership History
Date
Name
Owned For
Owner Type
Purchase Details
Closed on
May 17, 2006
Sold by
Tomlinson Jason and Tomlinson Lisa M
Bought by
Locke Hanley J and Greer Tamie K
Current Estimated Value
Home Financials for this Owner
Home Financials are based on the most recent Mortgage that was taken out on this home.
Original Mortgage
$49,481
Outstanding Balance
$29,016
Interest Rate
6.62%
Mortgage Type
FHA
Estimated Equity
$60,946
Purchase Details
Closed on
Sep 21, 2005
Sold by
Tomlinson Jason and Tomlinson Lisa M
Bought by
Tomlinson Jason and Tomlinson Lisa M
Purchase Details
Closed on
Feb 23, 2005
Sold by
Weber Jack and Weber Betty
Bought by
Bogard Barbara
Purchase Details
Closed on
Sep 21, 2001
Sold by
Wood James R and Wood Ester L
Bought by
Weber Jack G and Weber Betty
Create a Home Valuation Report for This Property
The Home Valuation Report is an in-depth analysis detailing your home's value as well as a comparison with similar homes in the area
Home Values in the Area
Average Home Value in this Area
Purchase History
| Date | Buyer | Sale Price | Title Company |
|---|---|---|---|
| Locke Hanley J | $50,000 | Garrow Title Agency | |
| Tomlinson Jason | -- | Sargents Title Company | |
| Tomlinson Jason | $27,500 | Sargents Title Company | |
| Bogard Barbara | $49,000 | Sargents Title Company | |
| Weber Jack G | $30,500 | Centennial Title Incorporate |
Source: Public Records
Mortgage History
| Date | Status | Borrower | Loan Amount |
|---|---|---|---|
| Open | Locke Hanley J | $49,481 |
Source: Public Records
Tax History
| Year | Tax Paid | Tax Assessment Tax Assessment Total Assessment is a certain percentage of the fair market value that is determined by local assessors to be the total taxable value of land and additions on the property. | Land | Improvement |
|---|---|---|---|---|
| 2025 | $1,302 | $38,800 | $0 | $0 |
| 2024 | $763 | $34,000 | $0 | $0 |
| 2023 | $721 | $31,600 | $0 | $0 |
| 2022 | $483 | $23,300 | $0 | $0 |
| 2021 | $1,142 | $20,000 | $0 | $0 |
| 2020 | $651 | $18,900 | $0 | $0 |
| 2019 | $643 | $17,000 | $0 | $0 |
| 2018 | $1,066 | $16,500 | $0 | $0 |
| 2017 | $1,039 | $16,500 | $0 | $0 |
| 2016 | $1,057 | $16,500 | $0 | $0 |
| 2015 | $870 | $15,100 | $0 | $0 |
| 2014 | $346 | $14,500 | $0 | $0 |
| 2012 | -- | $17,200 | $17,200 | $0 |
Source: Public Records
Map
Nearby Homes
- 2033 Eberly Rd
- 3277 Whitney Ave
- 18.41 Taft Rd
- VL Clairmont St
- 1512 Crescent Lane Dr Lot#46
- 10 Acres T A Mansour Blvd
- 3918 Larchmont St
- 3365 Ridgecliffe Dr
- 3088 Curtis Dr
- 3825 Arlene Ave
- 3915 Augusta St
- 4199 Sheraton Dr
- 3722 Larchmont St
- 3805 Brown St
- 4335 Lennon Rd
- 3801 Augusta St
- 4474 Corunna Rd
- 1455 S Linden Rd
- 4480 Corunna Rd
- 3320 Timberview St
- 2186 S Graham Rd
- 4019 Clairmont St
- 2202 S Graham Rd
- 4020 Larchmont St
- 2196 S Graham Rd
- 4025 Clairmont Ave
- G4035 Clairmont St
- G4045 Clairmont St
- 4025 Clairmont St
- 4024 Larchmont St
- 2193 S Graham Rd
- 4029 Clairmont Ave
- 4028 Larchmont St
- 2203 S Graham Rd
- 2187 S Graham Rd
- 2216 S Graham Rd
- 4035 Clairmont St
- 2173 S Graham Rd
- 4034 Larchmont St
- 2167 S Graham Rd
Your Personal Tour Guide
Ask me questions while you tour the home.